A Quick Comparison of 3x Funds BGZ and BGU
Courtesy of Corey at Afraid to Trade
With the S&P 500 up over 40% from its March 6 low, I thought it would be a good idea to take a quick look at 3x Leveraged Bullish Fund BGU and 3x Leveraged Fund BGZ for a chart and percentage comparison. Let’s see them in action!
3x Leveraged Bullish Fund BGU

What’s surprised me the most is how closely BGU has tracked with the Dow and S&P 500 and doesn’t seem to be as affected by the “percentage decay” that other leveraged funds have suffered (see BGZ below). It looks almost identical to the underlying index, despite being 3x leveraged. That’s rare in the leveraged fund world.
We see the same “Broadening Formation” I discussed in a previous post on the Dow Jones. The pattern is completing its upside target as shown here.
The one thing to watch is the glaring volume non-confirmation (or declining trend in volume) – volume spiked off the March 2009 lows at over 35 Million shares and now averages slightly above 10 Million – a significant drop-off.
Let’s compare the ‘chart perfection’ (in terms of tracking the underlying index) and now look at the Bearish Fund.
3x Leveraged Fund BGZ

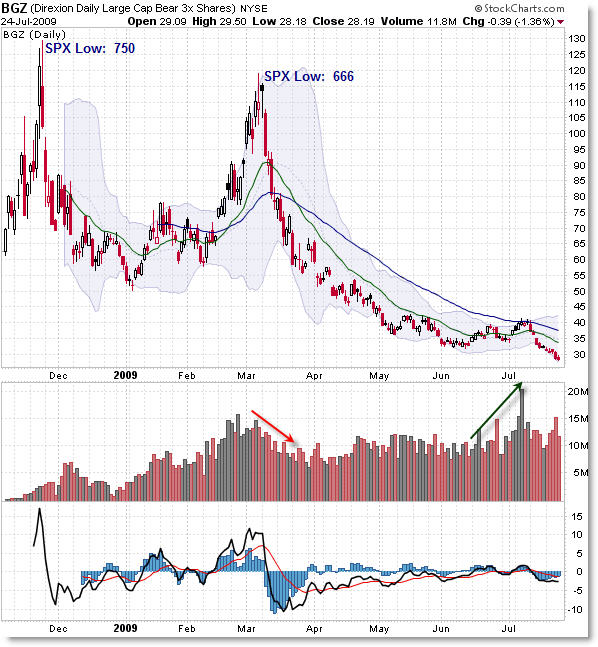
This pattern is what we would expect with a 3x (or even 2x) leveraged fund – quick swing ups (quick percentage gains) as the underlying index moves in a favorable direction but then a collapse as the index moves (in this c case) higher.
The risk in these funds is holding for a long time and trying to get back to break-even, which will never happen.
Notice that the S&P 500 made a swing low in December 2008 near 750 as the 3x Leveraged Bear Fund peaked at $130. However, when the S&P 500 made the March 2009 low of 666, the BGZ traded at a lower high of $118. The expectation was for the leveraged fund to make a much higher high but it was not the case – herein lies a major flaw of leveraged funds.
Leveraged funds suffer from percentage decay… the best example being that if you lost 50% of your capital, you could not muster a 50% gain to get back to where you started – you would need a 100% gain on your remaining capital.
As the underlying index (S&P 500, Dow, etc) fluctuates, the gains and losses of the leveraged fund will be magnified. This contributes to the inherent “price decay” in leveraged funds and why they are more appropriate vehicles for intraday or very, very short term trading tactics only.
The main point is that you CANNOT give leveraged funds “room to run” in a losing position… but that is for a whole other discussion.
Price has fallen from $120 to $30 – and we would need a 400% gain in the BGZ to get back to where price was on March 6th. That implies a 133% loss in the S&P 500 to reach those levels – clearly, this will not happen.
On a quick note – volume appears to be rising (flowing into) this 3x Bearish fund (or at least has not been trailing off like the broader indexes).
Let’s now zoom-in to the period from the March 9, 2009 low and compare percentages of these funds:
Percentage Comparison off the March Lows:

The S&P is up 43% from the March lows and the BGU 3x Bullish fund has rallied an amazing 170%!
However, the BGZ has fallen 75% from its earlier peak.
Remember that these funds are not for the faint of heart and perhaps should be avoided by new traders – prove your success and profits through the ‘plain vanilla’ SPY, QQQQ, and DIA market funds before jumping into the leveraged fund world – remember that it takes a lot more energy and time to recover from a large loss than from avoiding one.
Corey Rosenbloom, CMT
Afraid to Trade.com


