New charts from Allan, who seems to be predicting an end to the rally’s coming soon. Here’s why. – Ilene
Triggers to nastiness
Courtesy of Allan
Let’s walk through my most salient charts and analysis to see if we can identify any triggers to nastiness, so as to be ready when Ms. Market yells, "Pull."

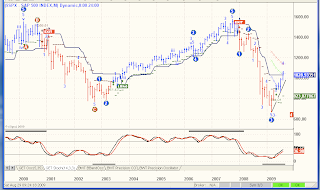
On the Monthly chart, with one day left in August, 1029.80 still prevents the ATR system from flipping positive. Blue Wave is four months into it’s Buy Signal and won’t flip Short until the 830’s.

On the Weekly analysis, we still see a triple divergence on the False Bar Stochastic as well as a stubborn wave count and pattern from Advanced GET warning of new lows to come. I’ve drawn a trend line that is walking up with price and is sitting right now at about 963, almost exactly where both Blue Wave and ATR will flip Short. Take note.

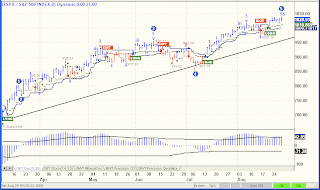
A close up Daily chart further clarifies and provides new REVERSAL levels, basis Daily closing prices:
ATR Daily flips SHORT @ 1000.71

The 90 minute chart shows an Elliott Oscillator on the bottom, highlighting a significant divergence between the oscillator and the recent new high in the SPX. Note also that while Blue Wave is still on a Buy on this chart, that ATR (solid navy line) is Short. Blue Wave triggers SHORT at 1023.04 and ATR triggers LONG at 1031.93, all basis 90-minute bars.

The 30 minute chart above shifts near-term focus to some tighter levels. Here, ATR is already on a SELL, requiring a 30 minute close above 1031.67 to flip Long. Blue Wave is again LONG here, requiring a 30 minute close below 1025.56 to join the ATR being SHORT.
In summary, the SPX closed Friday at 1028.93. Our trend-following systems are mixed, reflecting indecision, distribution or accumulation, take your pick. A thirty-minute bar that closes above 1031.67 or below 1025.56 will be the first indication that both systems are in agreement on near term price direction.
More significantly, if Prechter, Neely and Crawford are correct on intermediate direction turning hard down, then these charts provide a series of price thresholds that will confirm that trend, our triggers to nastiness:
90 minute @ 1023.04
Daily @ 1010.87 (BW)
Daily @ 1000.71 (ATR)
Weekly @ 963.00
Monthly @ 830.00


