Goldman Sachs GS Threatens to form Cradle Sell Signal
Courtesy of Corey at Afraid to Trade
I’ve been watching Goldman Sachs (GS) closely as a barometer for financial stocks and thus the broader market for some time now, and the stock faces a critical area to overcome to continue on its upward trajectory.
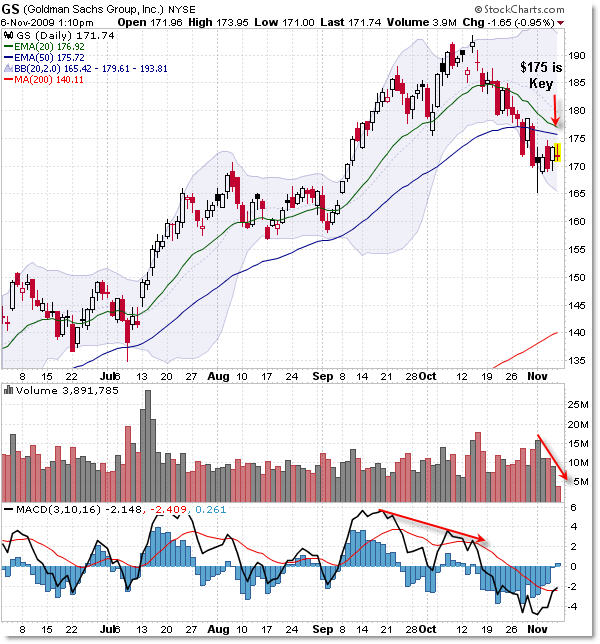
Let’s take a look at Goldman Sachs’ daily chart to note the overhead EMA resistance that is bearing down to form a potential Bearish Cradle Sell Signal… and then temper that bearishness with a look at the Weekly Chart.

Just doing quick commentary here, Goldman Sachs (GS) is underneath both the 20 and 50 day EMA and has formed a lower swing high, which is the first steps in beginning an official new downtrend. We’re not quite there yet, as the EMA structure is still positive, and a single lower low does not a trend reversal make.
But Goldman has to prove itself and claw its way back above these EMAs, or else a Cradle Sell signal will trigger and these EMAs could hold as overhead resistance, locking in a lower swing high and further deteriorating the upward movement.
A Cradle Sell Signal forms when the 20 period EMA crosses under the 50 EMA, as price rallies up into this “confluence crossover zone” of the EMAs, forming a potential “dual-wall” of overhead resistance. A doji or some other reversal candle would be the official ’sell short’ signal if these EMAs cross.
If price stays low, it looks like the EMAs will crossover bearishly at the $175 level, so let’s all watch that very closely for clues as to the potential pathway of Goldman for the future… and perhaps the XLF (Financial ETF)… and by proxy the general market.
But wait, there’s more!
If the daily chart looks like Goldman Sachs is about to fall into the abyss… the weekly chart is showing a nice ‘go long’ confluence moving average buy signal. What? Let’s take a look.

The 20 week EMA rests at $167 and the 200 week simple moving average rests at $164, forming a loose confluence zone at the $165 level as expected (and potential) support.
For now, and if Goldman closes to end the weekly candle to where it is now, then we would have a doji that has bounced off confluence support – a buy signal.
That’s the simple analysis and it throws a monkey wrench into the plans and hopes of the bears/sellers.
Additional analysis shows a negative volume and momentum divergence on the weekly chart for almost the whole duration of the rally in 2009 – that’s a bearish non-confirmation of higher prices and tilts the odds slightly to the bearish camp.
So we have resistance on the daily chart at $175 and support on the weekly chart at $165.
This is similar to the situation I highlighted occurred for IBM in my July 24th post:
“Daily and Weekly Conflicting Opportunities in IBM.”
I then followed-up on August 24th’s:
Updated Post on IBM Shows Why Multiple Timeframe Analysis is Critical.
The Weekly Bullish Signal in IBM overpowered the Daily Sell Signal in that example.
I also highlighted a similar pattern on RIMM in the June 30th post:
“Bullish or Bearish on RIMM? Depends on Your Timeframe.”
Like IBM, RIMM also took the bullish cue from its weekly chart, rallying to a new high in September… before collapsing back to $60.
Will it happen again in Goldman Sachs?
Watch $175 for a bullish breakout and $165 for a bearish breakdown to see.
Corey Rosenbloom, CMT
Afraid to Trade.com


