
Dark Horse Hedge: Market Musings
Courtesy of Scott Brown at Sabrient, co-author with me of The Dark Horse Hedge
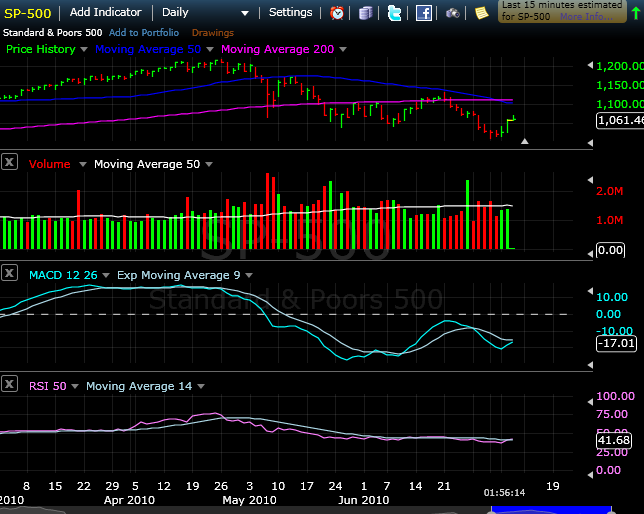
The SPX continues to trade below both the 50 and 200 day moving average (MA) but yesterday rallied to close above the once solid support level of 1040. The market bounce off the lows of July 2 also correlated with the Dark Cross formation which occurs when the 50 Day MA crosses the 200 Day MA downward. As we discussed in the Dark Horse Hedge, this has not traditionally held up as a good foreshadower of bearish activity. Nonetheless, it is worth noting that it took place.
With a low volume rally on Wednesday, and the lack of any follow through midway through Thursday, combined with the rally lacking any real quantifiable economic basis, the charts lead us to believe that Wednesday’s action was a relief rally so far. To begin even a modest short-term uptrend, the SPX will need to hold above the July 2 close of 1023 on any downward close and then break the close of Wednesday at 1060 or close today, whichever is higher. The 14 day RSI is slightly bearish at 41.68 and would need to cross 50 to become a bullish technical signal. As one other confirmation of the weak technical chart, I have added the 12-26-9 MACD which is currently -17 with the bullish signal line being a break of 0.
So in conclusion, the SPX had a earnings foreshadow or relief rally on Wednesday, with Volume below the 50-day MA. The index itself is remains securely below both the 50 and 200 day MA which have crossed. The confirmation by RSI and MACD lead us to believe that based on our reading of the current chart, the rally of Wednesday will have to retest 1040 and more importantly 1022 before it can move higher. If the next down move breaks 1022 and seeks what should be technical support from Sept 2009 of 995, we are technically in a downtrend.
The DDH started with a 67% SHORT tilt last Thursday which is confirmed through this chart analysis. On Tuesday, both LONG positions were up and the 4 SHORT positions were down creating the “Perfect Storm” for that day. DDH attempts to build a L/S virtual portfolio with the best fundamental companies held as LONG positions and the worst fundamental companies held as SHORT positions, to benefit the overall return in ANY type market.
Chart by Free Stock Charts