
Wall Street’s "Recovery" Leaves Main Street Mugged in the Gutter
Courtesy of Charles Hugh Smith, Of Two Minds

Rising costs and taxes and declining income have mugged Main Street while Wall Street revels in the Fed-engineered "recovery"–in the stock market.
The Fed would have us believe that the stock market is the leading indicator of the economy: if stocks are rising, then that is strong evidence the economy is improving.
This is the bogus "wealth effect" I have taken pains to discredit:
Why the Fed’s ‘Trickle-Down Economics’ Is Failing
Are the Fed’s Honchos Simpletons, Or Are They Just Taking Orders? (Nov. 1, 2010)
Fraud and Complicity Are Now the Lifeblood of the Status Quo (Nov. 12, 2010)
Fed’s QE2 Misadventure Costs U.S. Households $4.6 trillion (Nov. 10, 2010)
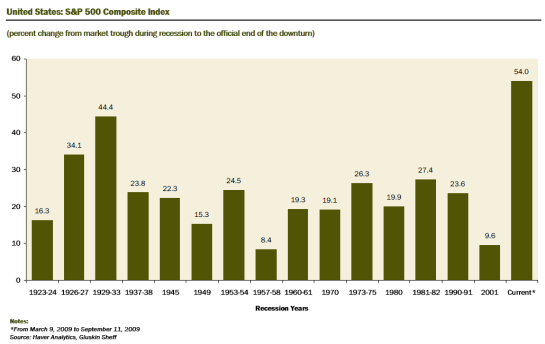
Main Street didn’t buy "the stock market is rising, so you must be richer" either, for the simple reason that Main Street’s wallet is now much thinner. Even as the S&P 500 has soared 80% from its March 2009 lows, 70% of Americans don’t believe the recession is over.
That must really hurt the apparatchiks in the Ministry of Propaganda and the Fed. Here they go to all this trouble to orchestrate a bogus stock market rally and Mainstream Media propaganda campaign hyping "the recovery," and Main Street America refused to buy it. How irksome.
It seems Main Street’s grasp on reality is firmer than that of either the Fed or its partner, Wall Street.
Let’s consider income.
The stock market rally off the March 2009 lows was by some measures the sharpest such advance in the past 100 years. Yet as stocks went on a tear,household income actually declined. According to the Census Bureau, the median household income fell 0.7% to $49,777 in 2009, down 4.2% since pre-recession 2007.
The Federal Reserve’s stated policy objective is to boost the stock market to trigger a "wealth effect" which will then lead consumers to open their wallets.
As noted here before, the Fed failed to notice that only the top 10% of households hold enough stocks to see much benefit from a rising market. Household income actually fell, despite the huge run-up in stocks.
In other words, a rising stock market did not increase household incomes. The Fed is gambling on an effect with no evidence to support it.
How about jobs?
While the Bureau of Labor Statistics reported that the economy added 151,000 jobs in October, Mish’s analysis finds that 330,000 jobs were lost according to the household survey, and even the BLS’s 151,000 was mostly "seasonal adjustment" fiction.
The BLS also reported "discouraged workers" increased by 411,000 and the labor participate rate fell again. Why does that matter? If there are 20 workers participating in the economy, and 10 are unemployed, then the unemployment rate is 50%. If nine of those unemployed drop out ("discouraged workers") and stop looking for work, then the unemployment rate magically drops to 9%: there are ten employed workers and only one unemployed.
In other words, the unemployment rate can fall not because there are actually more people getting jobs but because there are fewer people looking, i.e. in the labor pool. Here is a chart, courtesy of Karl Denninger and Market Ticker, which depicts the declining participation rate.
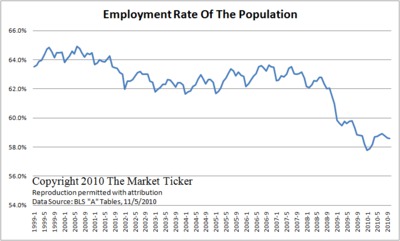
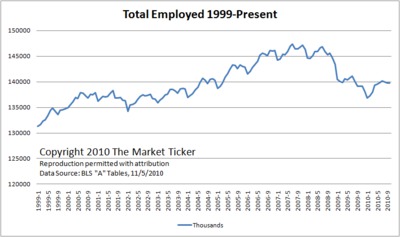
The total number of employed has bounced off a low but has flat-lined. If the "persons employed part time for economic reasons" (a BLS category) and those "marginally attached" (jobless but not counted by the BLS as unemployed because they had not searched for work in the 4 weeks preceding the survey), then the under-employment/unemployment rate jumps to over 17%.
This helps explain why the recovery appears so tepid to 2/3 of Americans: in terms of employment, it very clearly is tepid. This chart compares the current employment improvements with those of previous recessions. It is painfully obvious that the job market is still declining, not recovering.
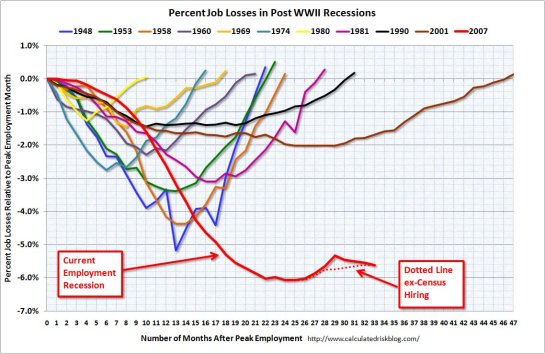
Unlike in previous recessions, the number of unemployed who have been jobless for 26 weeks or longer has skyrocketed, suggesting there is a structural dearth of jobs being created in the economy.
As the next chart illustrates, the primary reason the recession was not deeper is the Federal government and embarked on an unprecedented borrow-and-spend binge. The Federal deficit (that is, the increase in the national debt) was $1.6 trillion for fiscal year 2010, about the same size as the 2009 deficit.
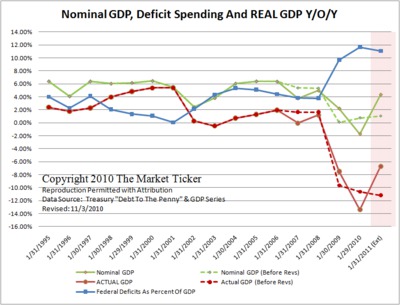
So the Federal Government borrowed and spent roughly 11% of the nation’s entire GDP. Economists who believe that the government should "spend our way out of recession" (the Keynesians) have been unable to explain why borrowing and spending a staggering $3.2 trillion in two years has done little beyond maintaining the status quo.
But the money is borrowed, and future taxpayers will see their incomes diverted to pay the interest on all that additional debt.
Even worse, the long-term liabilities being heaped on future taxpayers are growing by trillions every year. By some accounts, the unfunded liabilities for Social Security and Medicare alone (leaving aside all other government spending) is a mind-boggling $106 trillion.
Wall Street may be cheering this level of government borrowing and spending, but Main Street recognizes it is unhealthy and doomed to end badly for the American public.
How about the rising costs of essentials?
Though the official rate of inflation is a miniscule 1.1%, Main Street Americans sense this isn’t accurate when it comes to food and other essentials. As many observers have noted, containers and package sizes are shrinking, meaning the consumer is getting less for their money. This sort of "hidden inflation" (also called "value deflation") is not picked up by the official statistics.
The Commodity Research Bureau index of commodities, the CRB, is a widely recognized measure of commodity prices. The CRB has shot up 28% since the Federal Reserve announced its QE2 quantitative easing program. While Wall Street is beside itself with joy over QE2, Main Street looks down the road and sees huge prices increases ahead in food, energy and other essentials.
QE2 has certainly benefited Wall Street, but it has delivered Main Street a sucker punch of sharply higher prices in agricultural and energy commodities.
Meanwhile, taxes and fees have taken off and are climbing steeply.
Many observers find state and local tax revenues to be a more reliable measure of economic activity than GDP or unemployment statistics. After all, we only pay taxes out of real income and actual sales.
While state and local taxes have edged up 2.2% in the last quarter (April to June), indicating modest improvement in the real economy, the numbers are still considerably lower than in 2008 before the financial crisis in October 2008 triggered the recession.
According to the U.S. Census Bureau, total state and local taxes have slumped $38 billion compared to the second quarter of 2008–roughly 16%. Individual income taxes plummeted by almost 20% (from $99 billion to $71 billion), corporate taxes fell by 18% and sales taxes are off about 5%.
Reflecting the state local governments’ raising of tax rates and fees, vehicle taxes actually rose 5%. Despite the significant declines in property values, property taxes actually rose 14.7% from 2008 as municipalities jacked up tax rates.
With tax revenues based on incomes and consumption still way down from pre-recession totals, and the only increases in revenues coming from sharply higher tax rates and fees, Main Street has been mugged and tossed in the gutter while Wall Street chortles its way to billion-dollar bonuses and the Fed’s economists count the number of fictitious angels employed on the head of a pin.