
Understanding Market Cycles: The Art of Market Timing
Courtesy of Pharmboy
Study as if you were going to live forever; live as if you were going to die tomorrow. ~ Maria Mitchell
Get over the idea that only children should spend their time in study. Be a student so long as you still have something to learn, and this will mean all your life. ~ Henry L. Doherty
Welcome to Phil’s Stock World “Technical Trading 101” Handbook version 2.0! I think it’s a good time to update the handbook with newer charts and graphs, and give it more of a Biotech/Pharma fling. I also thought that ‘live’ charts could be used to place virtual trades. This would allow all to have a visual of trading patterns, as well as see how the charts are set up. This handbook is comprised of some simple methodologies in the art of Technical Analysis (henceforth referred to as TA). This handbook is not intended for novice traders, but it is my hope that by using examples that are ongoing in the market, all can become better traders AND investors.
TA is the art of reading charts and deriving a decision to buy or sell solely on the chart (something that Optrader does on his tab). Financial statements do not need to be read, as the chart speaks for itself. Technicians believe that past price patterns, trading actions, and price-volume relationships, among other indicators, form an accurate basis of where the stock is likely to move to in the near-term. Since price patterns on a chart are formed by investors & traders past emotional responses to price movements, the patterns can be exploited for use in the future.
TA is not a crystal ball! Patterns can, and will fail, and will result in losses. However, if the trader focuses on highly reliable patterns (e.g., shooting star), combine several indicators (e.g., MACD), and works on entry and exit points, a technician will be way ahead of the game.
This handbook begins as a macro view of the market and its cycles. The market cycles similar to the seasons of the year, move in and out of favor for various reasons. Dow’s Theory of the market discusses stock price movements that include, what is now called TA as well as some portion of sector rotation. By understanding fundamental analysis and using TA, a technician can use the information to make a strategic decision about trading a particular stock. When trading, the technician needs to decide what type of trade they are going to perform (e.g., scalp or momentum trade) and how to use TA. Charts and other indicators used within charts comprise the next few chapters. From there forward, candlestick patterns to aid in decisions about whether to trade a stock.
Experts and the main stream media say that market timing is impossible. In many cases that is true, but when TA is used, timing market movement is very profitable on a consistent basis. As a technical trader, the purpose is to find the best trades and to time the entry and exit points. Typically, when entering stock or option position, the amount should not be more than 10% of a portfolio, and at PSW, the mantra is to buy a 1/4 or 1/3 entry for the first leg in. After all, any trader can find the best trade in the world, but if it is not timed well, it may turn into a loss. Every stock or asset class goes through a classic market cycle. Figure 1 is a diagram of the four stages of the market cycle.
Figure 1. Four stages of the market cycle.
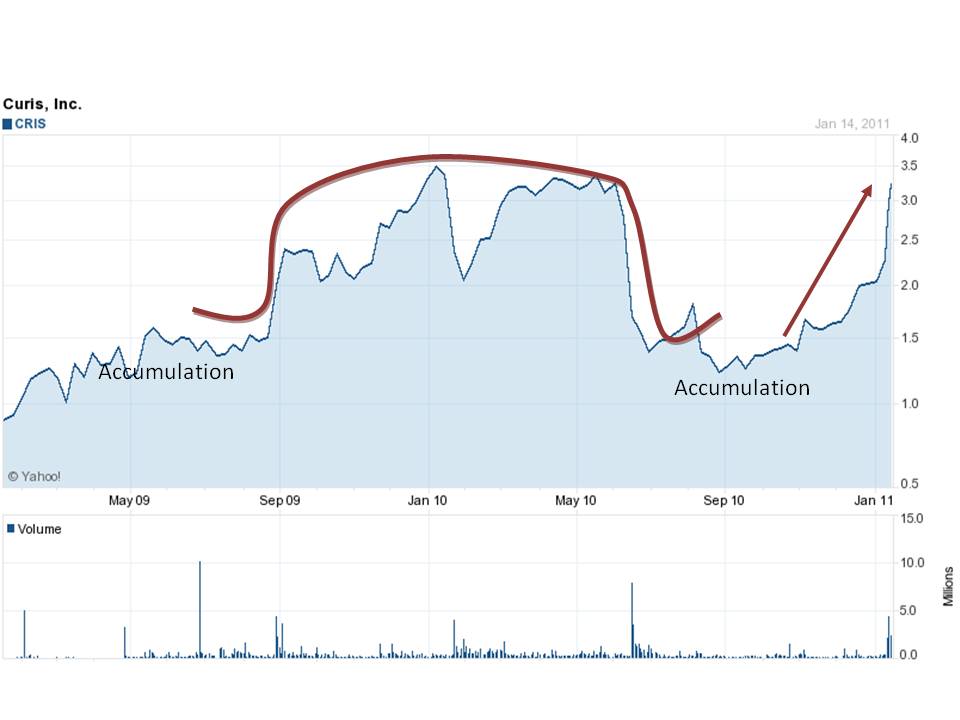
One such example of a market cycle was Curis (CRIS). Originally, CRIS was recommended in late 2009, and ½ of the position was sold in May 2010 for a nice ~50% gain. The company’s flagship drug, GDC-0449, had a setback in the summer of 2010. The science said it may work, but with late-stage colon cancer it was a huge hurdle to overcome. What was not considered and nice for PSW members is that the accumulation was back in favor in late summer, as there were 19 other clinical trials ongoing for GDC-0449. Therefore, the ups and downs of the stock price moved in cycles. By observing those cycles, it was much easier to comprehend the next moves. Figure 2 shows Curis stock that has completed of the four stages and now appears to be on the move back up. The question remains, when to get out? Many traders at PSW sold at least 1/2 of our stock, knowing that if the stock moved back down, a trade could be made again.
Figure 2. Market stages for Curis.
For a long-term investor or trader, understanding market cycles can greatly benefit their portfolio. The accumulation phases are the type of opportunities that allow for buying into the smaller dips, averaging down the stock until the amount in a portfolio is reached (typically not more than 3-5% for any one higher risk stock, or 10% for a S.I.R.P. – safety and income at a reasonable price stock) (D. Rosenberg’s phrase).
Stages of a Market Cycle
- Accumulation Phase – This is the bottom (or near the bottom) of a particular stock, sector, or general market. At this stage, prices do not move upward but rather stay within a neutral trading range. At this level, the smart money begins to buy up large blocks of shares to accumulate a large position for their portfolio. They are patient enough to wait years, if needed, because it is difficult to determine how long a stock or sector will be in this stage. Regular individual retail investors do not even consider buying at this level because, in most cases, they have recently sold into the lows. At PSW, this is the stage where stocks are nominated to the Buying a Stock for a 15-20% Discount and in many cases is where the biggest discounts are found. Long-term oriented investors should be buying to realize the greatest long-term gains. Traders and investors alike are buying in this stage of the market cycle.
- Mark Up Phase – This phase follows the Accumulation phase. The way to determine if this phase is occurring is to see a stock or sector that has “broken out” of its neutral range. This means that it must break above the upper trend line of the neutral range. From this point on, an obvious increase in volume should be seen. Most of the institutions and individuals who are aware of this early trend will jump on board and bring along significant buying power with them. Another way to tell if the stock is in this stage is to see if higher lows and higher highs are forming. Toward the end of the mark up phase, full market participation will be noted as everyone will most likely have made an investment. This is a set up for the next phase. Traders and investors alike are buying in this stage of the market cycle.
- Distribution Phase – This is the top of the market for a particular stock, sector, or general market. Supply overwhelms demand after the smart money sells their shares to the “greater fools” who buy at the top (usually retail). Because there are no other buyers left to raise the price, a stock or sector cannot advance higher, and thus, will collapse under its own weight. The sentiment is extremely bullish. This phase is marked with extreme greed and fear. The best way to identify a top is through chart patterns, most notably, the head-and-shoulder anddouble top formations combined with breakdowns at the 200-day moving average (MA). This phase is usually marked by the greatest volume levels for a stock until it reachs the Accumulation phase once again. Traders begin to take short positions and investors begin to sell in this stage of the market cycle.
- Mark Down Phase – Prices are in free fall and stocks are in full liquidation mode. This group is made up of people who held beyond the Distribution phase and did not sell, or those who bought at or near the top and refuse to sell at a loss. Either way, a loss will be incurred or the size of it will be determined when an investor wishes to sell it. A trader should not buy at this stage and those that try to find a bottom will be disappointed.Traders short the stock in this phase, where investors wait for the accumulation phase.
- Return to Accumulation Phase
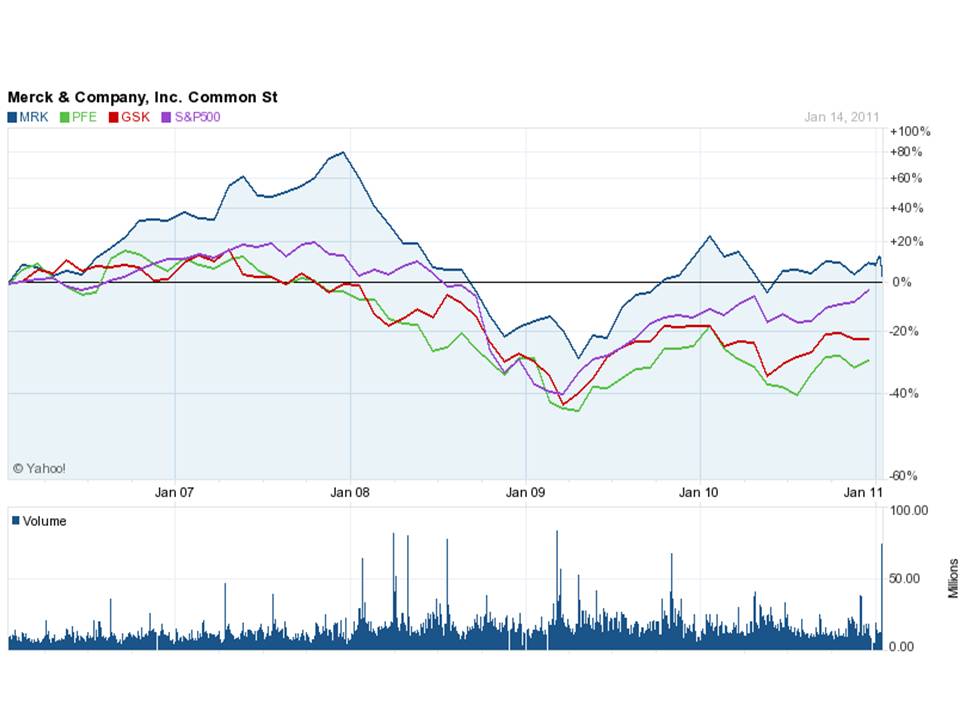
The Pharmaceutical sector is a good example of how it is possible to profit from their recent market cycle. As shown in Figure 3 where all the companies in the industry were rising and falling in the same time frame.
Figure 3. Market cycles for the Pharmaceutical giants Merck, Pfizer and Glaxosmithkline versus the S&P.
Sentiment Cycle
In addition to the actual price cycle, there is also a sentiment cycle which accompanies each stock, sector, or overall market. By definition, the market balances buyers and sellers, so that there is a balance between positive and negative sentiment. Thus it is impossible for a high proportion of market participants to have negative sentiment. However it is possible to argue that when a high proportion of financial commentators and advisors express a bearish (negative) sentiment, some people consider this as a strong signal that a market bottom may be near. The predictive capability of such a signal (e.g., market sentiment) is thought to be highest when investor sentiment reaches extreme values. Indicators that measure investor sentiment may included:
- Investor Intelligence Sentiment Index: If the Bull-Bear spread (% of Bulls – % of Bears) is close to a historic low, it may signal a bottom. Typically, the number of bears surveyed would exceed the number of bulls. Conversely, if the% of Bulls is at an extreme high and the number of Bears is at an extreme low, historically, a market top may have occurred or close to occurring. This contrarian measure is more reliable for its coincidental timing at market lows than tops.
- American Association of Individual Investors (AAII) sentiment indicator: Many feel that the majority of the decline has already occurred once this indicator gives a reading of minus 15% or below.
- Other sentiment indicators include the Nova-Ursa ratio, the Short Interest/Total Market Float, and the Put/Call ratio.
Figure 4 shows the general range of emotions investors experience as related to market risk.
Figure 4. Cycle of Market Emotions.

At PSW, there are traders and investors alike, and using the wide range of talents and emotions, the group gauges the emotions, and attempts to use all the data to decipher where we are in the sentiment cycle. We also use Bob Ferrell’s “10 Market Rules to Remember” noted several years ago. The words of wisdom are timeless and are especially appropriate as investors grapple with the difficult juncture at which stock markets find themselves at this stage.
- Markets tend to return to the mean over time – When stocks go too far in one direction, they come back. Euphoria and pessimism can cloud a trader’s head as it is easy to get caught up in the heat of the moment and lose perspective.
- Excesses in one direction will lead to an excess in the opposite direction
- There are no new eras – excesses are never permanent.
- Exponential rapidly rising or falling markets usually go further than you think, but they do not correct by going sideways.
- The public buys the most at the top and the least at the bottom – Hence at PSW, caution is always exercised and if the traders/investors follow the sentiment indicators and have good timing, money can be made.
- Fear and greed are stronger than long-term resolve – Investors can be their own worst enemy, particularly when emotions take hold. Gains “make us exuberant; they enhance well-being and promote optimism”, says Santa Clara University finance professor Meir Statman. His studies of investor behavior show that “Losses bring sadness, disgust, fear, regret. Fear increases the sense of risk and some react by shunning stocks.”
- Markets are strongest when they are broad and weakest when they narrow to a handful of blue-chip names – This is why breadth and volume are so important. Phil and others in the chat room constantly update the movement of the dollar and the trade volume to help understand the movement of the market. Ferrell notes that broad momentum is hard to stop, but low volume causes pause.
- Bear markets have three stages – sharp down, reflexive rebound and a drawn-out fundamental downtrend
- When all the experts and forecasts agree, something else is going to happen – At PSW, calls for staying in cash have been reiterated for a few months.
- Bull markets are more fun than bear markets – Especially if you are long only or mandated to be fully invested.
A trader is their own worst enemy because emotions give room for destructive impulse trading. By understanding each cycle and what emotions follow, traders can be better prepared. Market cycles are normal, necessary to balance the financial markets and restore equilibrium to forces of supply and demand. Understanding these market cycles and being able to recognize where we are in the cycle can help us to be better investors. Join us at PSW in member chat where a group of traders and investors pass ideas and Philosophies for future gains.


