
Courtesy of Rick Davis of Consumer Metrics Institute
During the past month the year-over-year surge that we have witnessed in our Weighted Composite Index has finally topped out, after setting an all-time record high of 115.92 on September 9, 2011:
Since then the Weighted Composite has receded about 5%. This relative softening can be seen in the chart of the past 60 days of our Absolute Demand Index, which removes the year-over-year influences and charts the data against the average consumer discretionary durable goods demand levels for 2005 (adjusted for on-line commerce growth):
(Click on chart for fuller resolution)
(If a chart is not visible above, please click here to see this commentary as a Web Page.)
It remains almost breathtaking to realize that the level of consumer demand for discretionary durable goods is still lingering in a zone that is about 10% below the absolute levels experienced in 2005. The year-over-year comparisons may look good, but every now and then you have to step back and take things into a longer perspective.
Meanwhile, the comparisons against the dismal data from late summer 2010 are still driving our trailing 91-day Daily Growth Index to record levels:
(Click on chart for fuller resolution)
And a reminder is in order: those comparisons against dismal data will continue until late spring 2012. We may be entering into an extended period of time when our Absolute Demand Index will be our preferred view of the data, since even flat demand will continue to look good on a year-over-year basis.
Sector Details
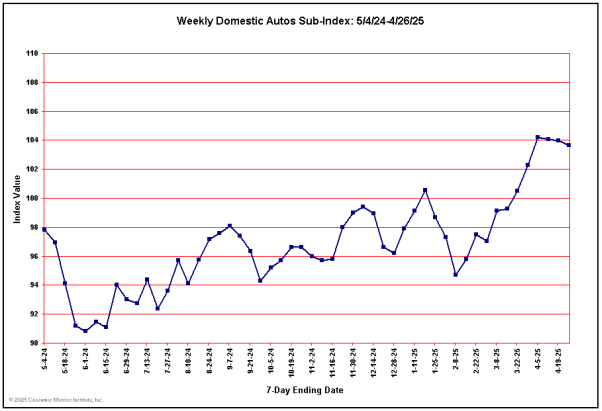
We have thought for some time that the Automotive Sub-Indexes were telling us something about the character of the consumer experience during this "Great Recession." The problem is that we’ve never been quite sure what we’re being told — other than that the experiences have not been fully shared. Over the past month there has been a significant upward movement in the Automotive Index:
One of the key aspects of this improvement is that it has been powered to a large extent by the Domestic brands:
This movement is particularly spectacular when compared to the movement of the Korean brands over the same time period:
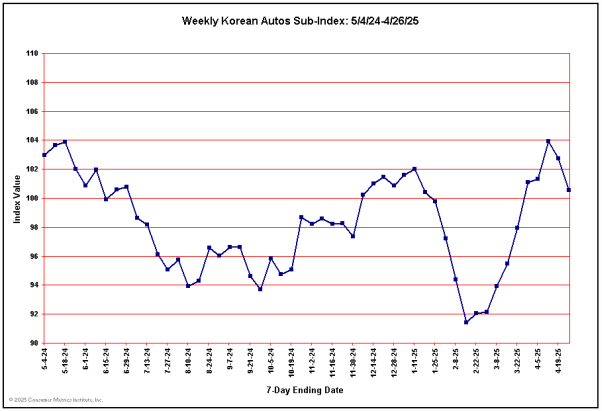
In fairness, the scales of the two charts are different, and the Korean brands continue to show stronger year-over-year demand than the Domestic brands — but that gap has clearly been closing over the past few months. We’re not sure what that means demographically, since for the most part the Korean brands had been making their multi-year gains among younger buyers with fewer long-held brand loyalties and a keen interest in price.
One of our other themes has been that consumers will respond positively to declining gasoline prices, since they now have more cash in their pockets when leaving the gas pump than they did some 6 months ago. In general we find that the new found money does not go into durable goods or items that require the assumption of additional debt. We have coined the term "Self Medication Trinkets" to describe the feel-good spending that can signal the availability of more pocket cash:
And the expenditures can also find their way into impulse items that have higher sticker values:
Or even greater self indulgences that have been postponed for an extended period of time:
One area, however, where we are not seeing the money go (this time around) is Technology Toys:
Our Weighted Composite Index is highly influenced (weighted) by transactions relating to homes and the housing industry. We had mentioned several times before that we saw a major uptick in consumer demand for new home loans:
We had speculated that some of that increase was driven by the "doom-and-gloom" forecasts in the popular media about the U.S. Federal budgetary mess driving interest rates up sharply in the near future. Any such uptick might have pulled housing sales forward in anticipation of mortgage rates climbing. But since then Mr. Bernanke has made it clear that interest rates are not likely to go anywhere until sometime in 2013 — and the surge that we were watching has completely fizzled.
But we continue to see action in other home improvement areas, including major appliances:
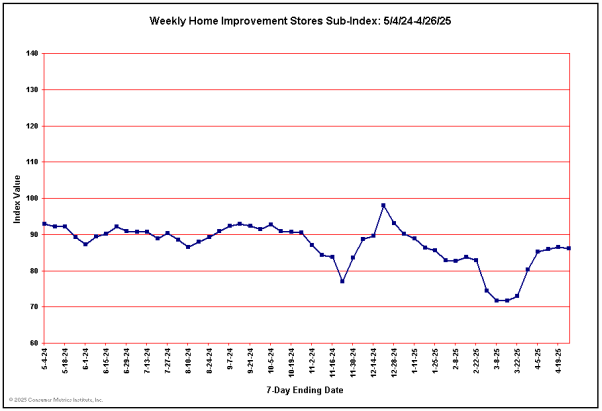
and general traffic to home improvement stores;
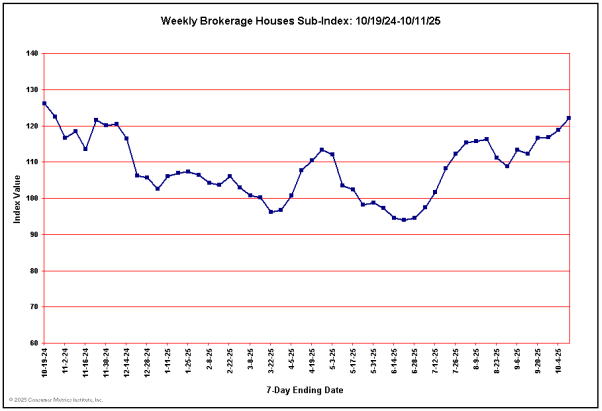
And finally, we would be remiss if we did not point out the very recent decline in interest in brokerage products:
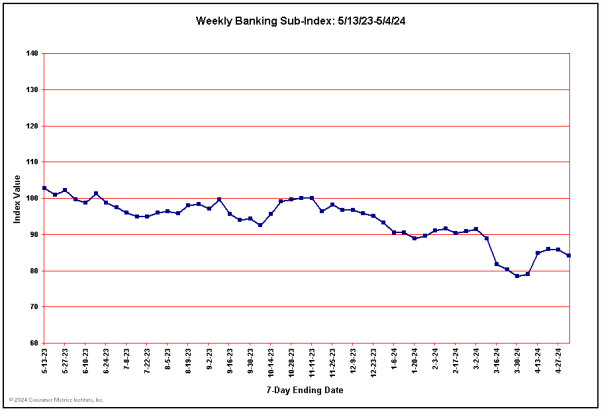
This has often happened before, but it generally has been accompanied by sharply increasing interest in banking products. This time around we are seeing a new dynamic, with demand for both kinds of products softening concurrently:
As has happened before during the "Great Recession," there are many interesting things happening in the consumer arena that we can monitor but perhaps never fully understand. Which is in itself understandable — if we only pause to realize that the U.S. consumer economy is nothing more than a chaotic mix of 100 million loose household cannons acting in their own economic self interest.


