

Courtesy of Doug Short.
Advisor Perspectives welcomes guest contributions. The views presented here do not necessarily represent those of Advisor Perspectives.
SPX, DJIA and NDX all ended the week at new highs. For them, the trend remains higher.
What is most interesting is the small cap index, RUT. Not only did it lose 1.2% this week while the other indices gained, but it is now more than 5% off its peak. For the year, RUT is negative and SPX is up 9%.
Is this divergence between SPX and RUT bearish? It would seem it should be. When small caps underperform, it indicates weakness in breadth as investors concentrate their buying in a relatively small number of large companies.
The problem is these divergences have usually not been bearish in the past few years. The yellow highlights below are times when small caps underperformed large caps (lower panel). Each time, SPX continued higher (top panel). The main exception was in 2012 (in orange).

Moreover, there were several instances where small caps outperformed large caps right into a market peak (shown with arrows). If anything, that has been a better predictor of trouble for SPX. Why would this be? When small caps outperform, investors are chasing performance. It’s a beta chase, and this indicates exuberance. At an extreme, this exuberance is punished with a market correction. All of that said, the overall pattern in RUT is concerning. Below is a weekly chart since the early 1990s. Previously, when RUT has run up strongly and then formed a choppy horizontal pattern over many months (like now), it has been a noteworthy top. In each of these prior cases, RUT has subsequently fallen at least 15% and sometimes 30% or more. SPX is not likely to emerge unscathed if RUT falls more than 15%. As we have continually pointed out, RUT is valuable canary for the overall market, for both strength and possible weakness.

One of the issues likely plaguing RUT’s performance is valuation. RUT nearly doubled between 2012 and the start of 2014. It strongly outperformed SPX. During this time, it went from being relatively undervalued to be overvalued (more than a standard deviation above its mean). The only times valuations have been as high as now were in 1998 and 2000, and RUT tumbled more than 30% both times (chart from GS)

It’s worth pointing out that overvaluation is not unique to RUT. Whether you base the valuation metric on sales, current earnings, past 10-year earnings or balance sheet measures, US equities are trading at a significant premium. The chart below uses Tobin’s Q, a valuation metric based on firms’ balance sheets. The only higher valuations in the past 115 years came at the end of the 90s (chart from Doug Short).

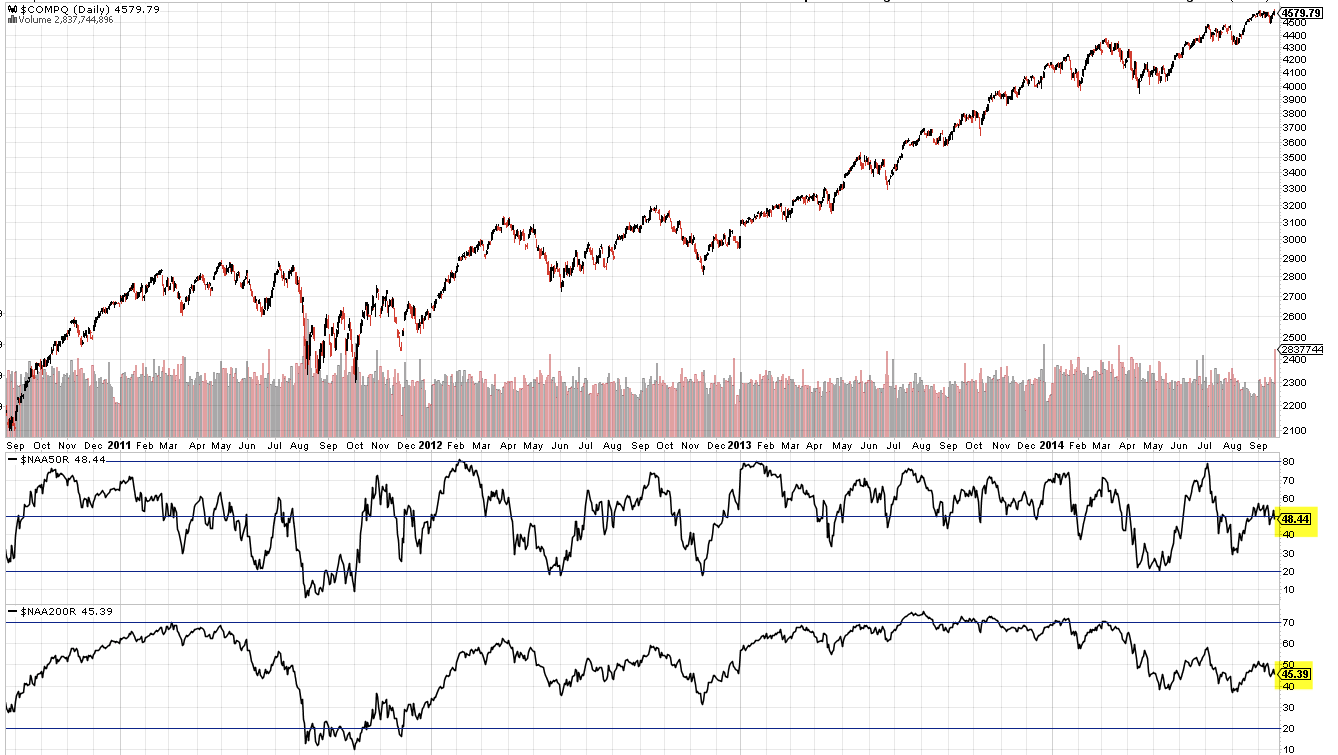
It’s also worth pointing out that the weak breadth that small caps are signaling is present in the broader market as well. Remarkably, less than half of Nasdaq stocks are trading above either their 50-dma or 200-dma. You would be hard pressed to find a similar circumstance with breadth that weak when the index is at a 14 year high.
The Week Ahead
Our expectation in our last update was for equities to rise further. Recall that SPX had closed above its 5-dma for 18 days in a row for only the second time in the past 5 years (the other time was June 2013). That type of strength rarely marks the end of an uptrend. Momentum carries the index higher. It did again this time.
8 of the 9 SPX sectors remain in a strong uptrend (the exception is energy) as are SPX, DJIA and NDX. The trend appears to be broadly higher.
That said, our expectation is that markets will turn week, at least short term.
Read the remainder of Urban’s commentary at his website.
© Urban Carmel
The Fat Pitch


