

Courtesy of Doug Short.
Advisor Perspectives welcomes guest contributions. The views presented here do not necessarily represent those of Advisor Perspectives.
After making bull market highs last week, equities lost 1% this week, led by small caps (RUT) which shed another 2.4%. With RUT now down 8% from its July high and under its 200-dma, investors are starting to wonder whether a larger correction is underway.
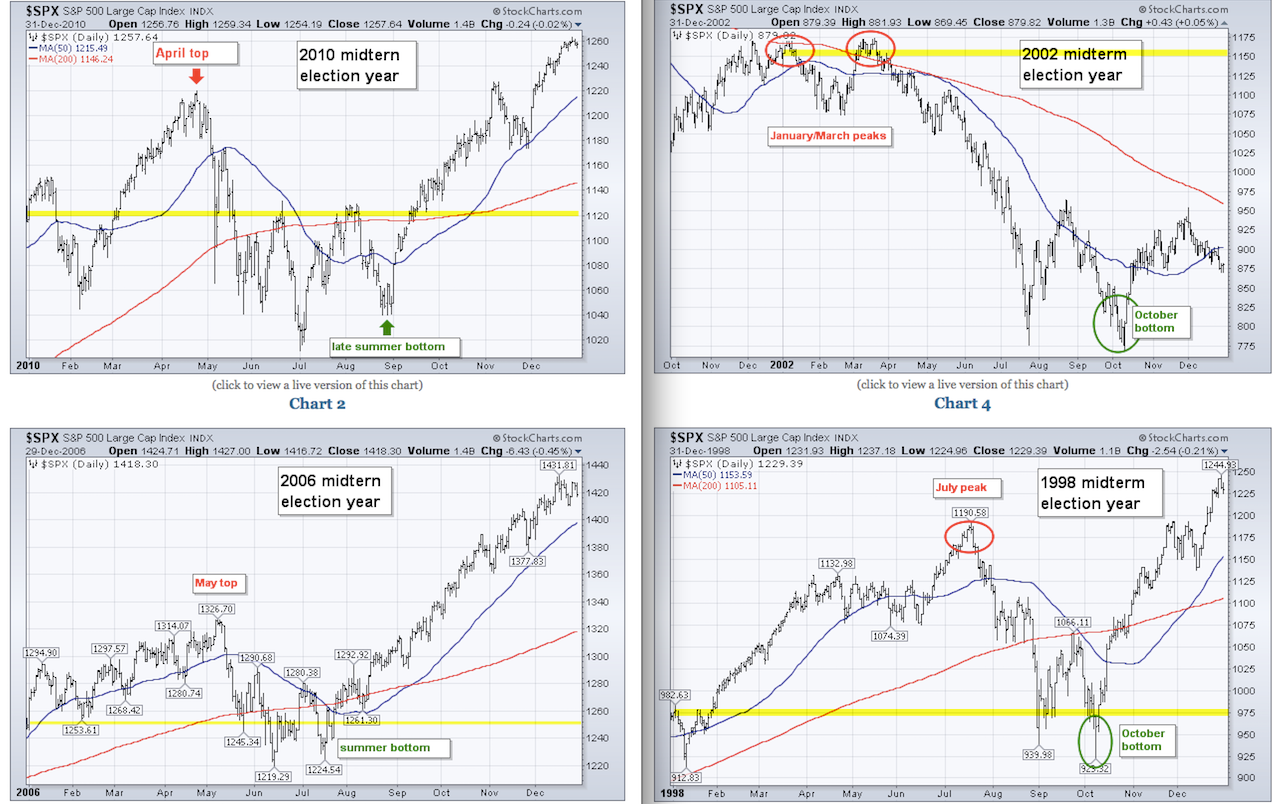
One reason to expect a larger sell off is that that has been a pattern during mid term election years. As an example, in the past four mid-term years, SPX has sold off by 8%, 16%, 20% and 34%; from its high to its eventual low has taken 2-6 months. In the past 6 months, the largest correction was 4.5% and took just 11 days.
Another reason is that SPX will have traded above its lower Bollinger band for 22 months by the middle of this coming week. That is four months longer than even the powerful 1995-96 period.

The powerful and sustained move higher in equities has not gone unnoticed. Investors have gone longer without even a brief period of bearishness than any period in the past 25 years. This even includes the hyper bullish 1990s bull market (chart from Yardeni).

Why have US equities been so exceptionally strong? It’s not the macro environment. The revised 2Q GDP data released on Friday shows growth of 2.6%; in the 1990s, it was consistently over 5%. “Real final sales” (GDP less changes in inventories) shows consumption growing at just 2.3%, an essentially unchanged level of growth over the past 2 1/2 years and quite a bit lower than during prior bull markets.

One reason for the strong performance of equities is liquidity. This liquidity is probably reaching a saturation point. Let’s review several sources of liquidity – from the Fed, corporates and traditional investors – that have contributed to high demand for equities.
Perhaps the most contentious is from the Fed through its permanent open market operations (POMO), in which the Fed buys securities in order to increase banking reserves. Either some portion of this liquidity has influenced the equity market directly or investors’ belief that it will has indirectly led to higher prices.
Either way, monthly POMO flows are slowing (table). In 2012, monthly flows were $45b, equal to $540b over the course of a year. These have been reduced since the start of 2014. In September, it was down 67% to $15b. It’s possible that the Fed will announce the end of POMO in October. A tailwind for the market is going away.
Second, corporate share purchase programs provide a boost to equity demand, but these programs are also waning in size. Over the past 12 months, buybacks have amounted to $539b; coincidentally an amount equal to POMO in 2013. In 2Q14, share buybacks dropped by $50b (annualized). The flows are still positive, but the rate may be starting a period of decline. In the chart below, higher buybacks (blue bars) correspond with higher equities (red line). The last two drops in buybacks were in mid-2011 and mid-2012, both periods where equities also fell (chart from FactSet).

Finally, it seems that investors’ disposition for leverage in buying equities is also waning. Leverage as a proportion of market capitalization reached an all-time peak in February; since then, it has stalled. Unsurprisingly, rising leverage corresponds to rising equities, and vice versa. With the amount of leverage at a peak, further strong increases are less likely (chart from Doug Short).

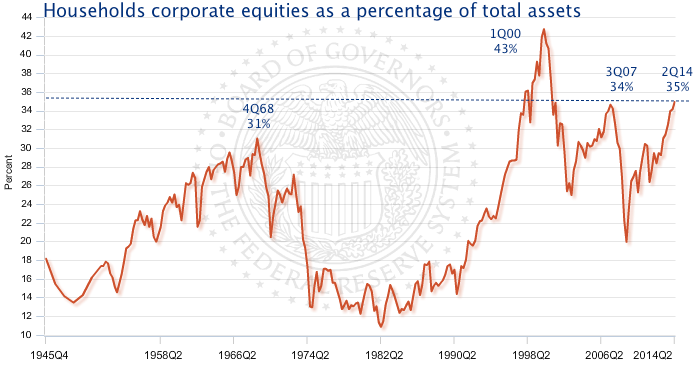
As an aside, it is worth noting that households’ financial portfolios already include a very high proportion of equities. That was not the case even one year ago. Note in particular how strongly those equity allocations have recently risen. This corresponds directly with the sharp rise in share prices (chart from the Fed).
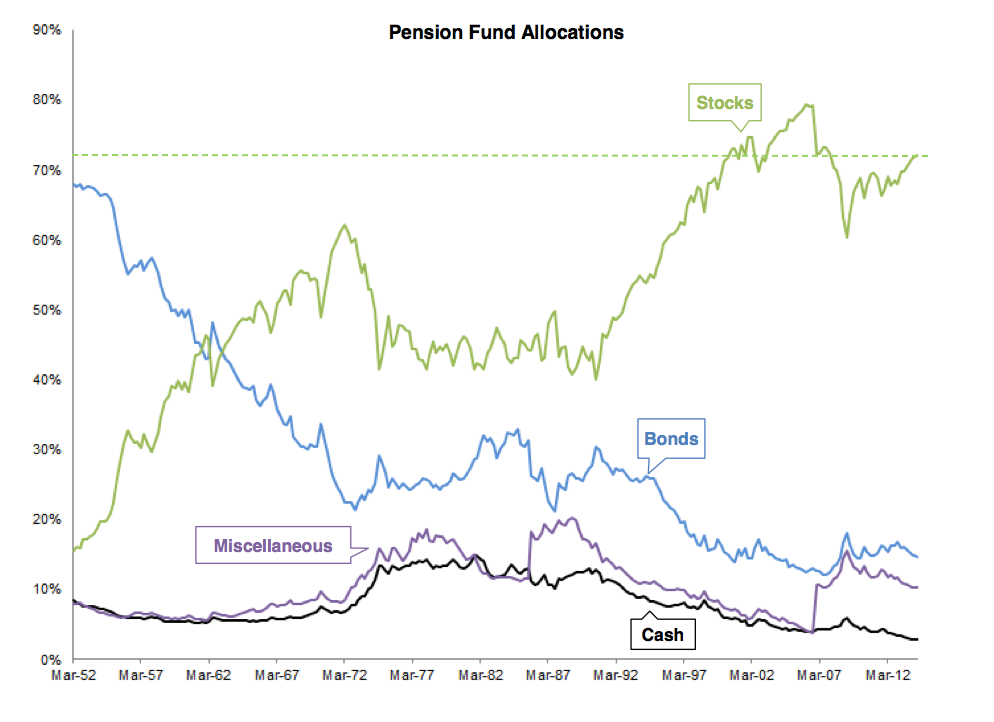
This is also the case for pension funds. Again, the point is not to imply that equity allocations are, de facto, set to fall. But, equities rise the most when investors have been underweight. That’s no longer the case: both the chart above and the one below show a dramatic rise in the past two years. Also take note of cash levels (black line), which have not been lower in the past 65 years. New equity purchases have to come from sales of another asset and both cash and bonds holdings are relatively low.
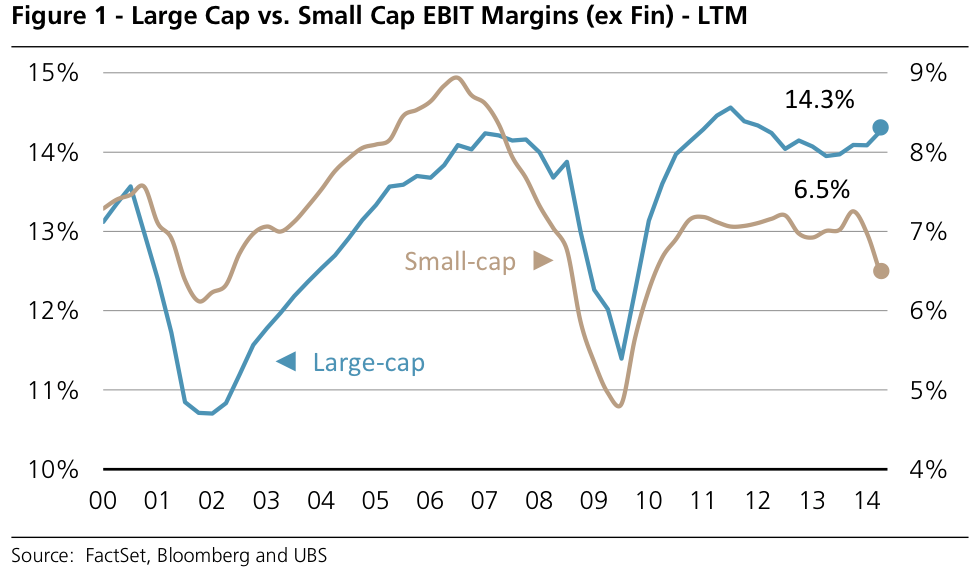
So, the liquidity tailwind to equities is probably easing. Selling RUT first makes sense. We showed last week that their valuations are at a significant premium. There is also a reasonable concern that small cap profit margins have peaked.
That’s a legitimate source of concern for the broader market. In the past two years, SPX is up approximately 45%. About 70% of this gain is from multiple expansion. Another 15% is from margin expansion and the remaining 15% from sales growth. Stagnating margins when multiples are already at a premium leaves the market reliant on only sales growth. If the trend in macro growth continues to be a good barometer for corporate sales growth, then the rate of share appreciation will likely approach 2-3% (real).
The Week Ahead
The set up coming into this week was squarely bearish: SPY up against a verified resistance line, a break in RUT below 1160, poor seasonality, a likelihood for higher Vix, rising equity put/call ratios and a spike higher in Skew all suggested a downside edge (post). In the event, markets had their largest sell off in two months.
Read the remainder of Urban’s commentary at his website.
© Urban Carmel
The Fat Pitch


