

Courtesy of Benzinga.
Verizon Communications Inc. (NYSE: VZ) stock has rallied nicely off of the October lows, where the stock broke down below its uptrend line support. Now that the stock has seemingly completed five mini-waves to the upside, it is due to pull back.
How far must if fall before the stock is a technical buy? Do the company's fundamentals justify a renewed push to the upside once support is tested? Let's take a look.
What The Bulls See
A 4.3 percent annual dividend with a reasonable 44 percent payout ratio.
Some cheap valuation metrics: An enterprise value of $315 billion vs. a market capitalization of only $212.55 billion and a price to sales ratio of 1.71.
A net profit margin of 15.54 percent that spins off an annual levered free cash flow of over $22 billion.
What The Bears See
- A PE of 14, which seems a bit expensive when compared to the 2015 estimates for growth in revenues and EPS of 2.9 percent and 10.10 percent, respectively.
- Lots of debt: A debt to equity ratio of over 600 percent, a current ratio of only 0.92 and a cash of $7.85 billion vs. total debt of $109.49 billion.
The Technical Take
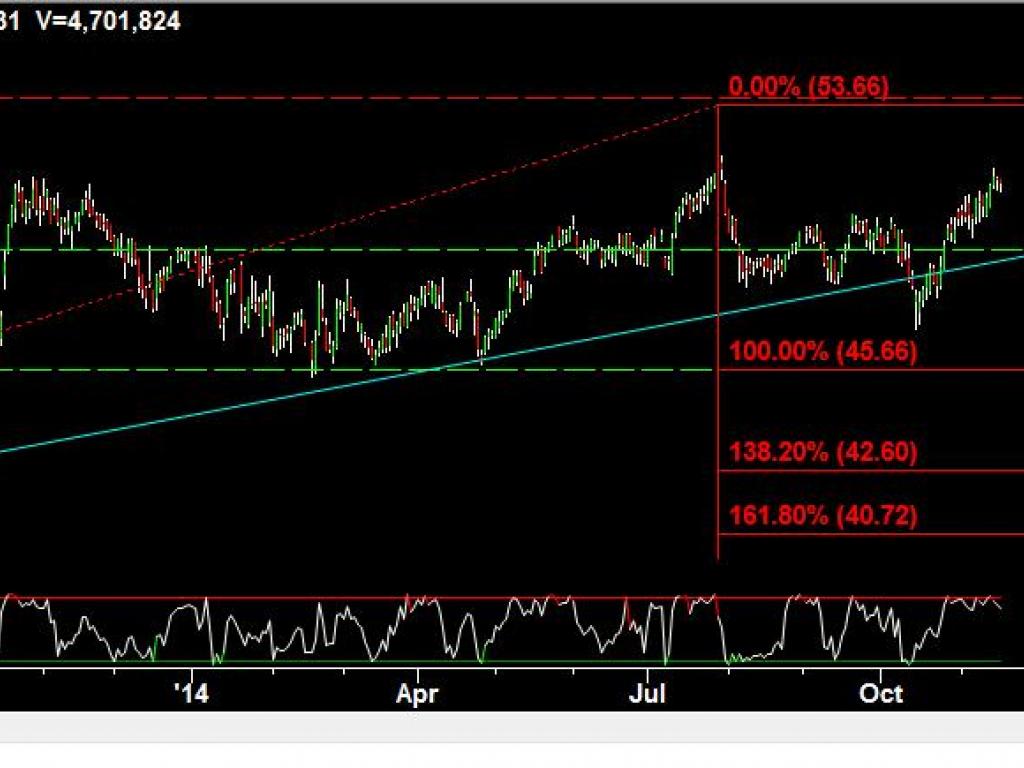
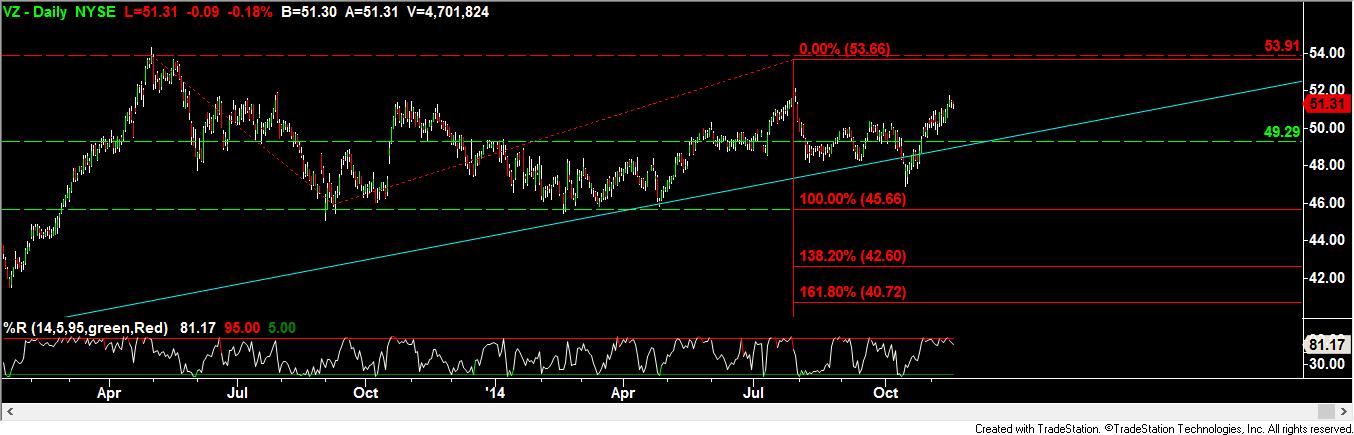
Technicians note that there appear to be two possible paths for Verizon shares: down a little or down a lot. In the "down a little" scenario, the stock will pullback to the uptrend line support at around $49.29, which was broken recently and then recaptured by the bulls. If that level of support holds, then Verizon could rally back up towards the August high at $53.66.
The more bearish scenario is where Verizon is in the midst of a wave "c" lower with a downside target of $45.66. That level is the 100 percent Fibonacci price projection line for the "abc" downside correction and corresponds well with horizontal line support.

Posted-In: Long Ideas Short Ideas Dividends Technicals Intraday Update Movers Trading Ideas


