

Courtesy of Doug Short.
The big economic number this week will be the Q1 Advance Estimate for GDP on Wednesday at 8:30 AM ET.
What do economists see in their collective crystal ball for Q1 of 2015? Let’s take a look at the GDP forecasts from the latest Wall Street Journal survey of economists conducted earlier this month.
Here’s a snapshot of the full array of WSJ opinions about Q1 GDP with highlighted values for the median (middle), mean (average) and mode (most frequent). In the latest forecast, the median and mean were quite close. The mode (ten of 62 forecasts) was a tad lower at 1.2%, and the second most frequent value, held by eight respondents, was bit higher 1.5%. In essence, 35% of the economists’ forecasts fell within a narrow 0.3% range.
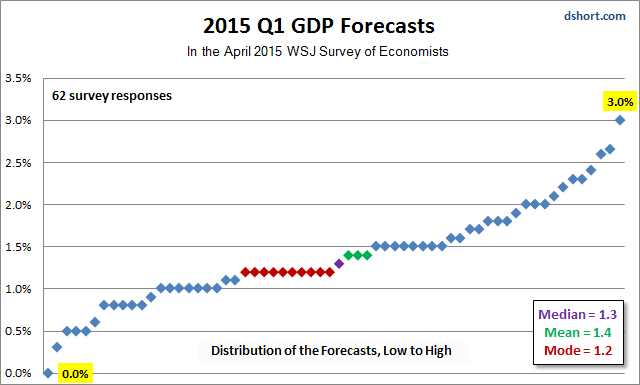
As the visualization above illustrates, despite the cluster in the middle, the overall opinions ranged from a grimly pessimistic 0.0% to a happy outlier at 3.0%.
The Investing.com consensus is for 1.0%. The Briefing.com consensus is fractionally higher at 1.1%, but its own estimate is for 0.4%.
GDP in 2015
Wednesday’s release of the Advance Estimate for Q1 GDP is, of course, a rear-view mirror look at the economy. The WSJ survey also asks the participants to forecast GDP for the four quarters of 2015. Here is a table documenting the median, mean and extremes for those forecasts.
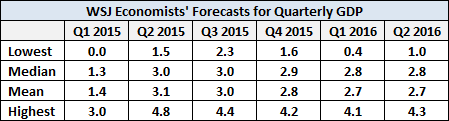
Interestingly enough (or should I say “boringly enough”), the median for the next five quarters hovers in a tiny 0.2% range and the mean (average) drifts down ever so slightly in a narrow range from 3.1% to 2.7%.
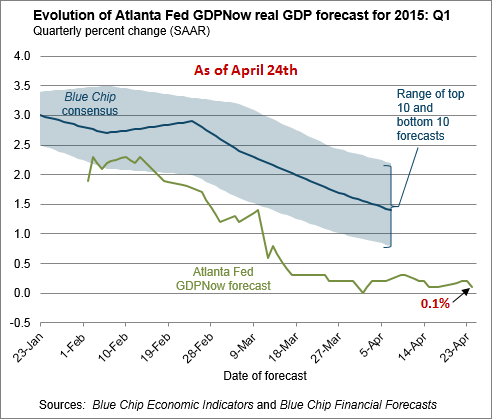
About that Pessimistic 0.0% for Q1 GDP…
The WSJ respondent who put Q1 GDP at 0.0% has a well-known institution, the Atlanta Federal Reserve, in support of the low forecast. See their GDPNow™ forecasting model, which currently puts Q1 GDP at 0.1%
GDP: A Long-Term Historical Context
For a broad historical context for the latest forecasts, here a snapshot of GDP since Uncle Sam began tracking the data quarterly in 1947. The Q3 WSJ median and mean forecasts are above the 1.6% 10-year moving average and just a tad below the 3.3% Quarterly GDP average since its inception in 1947.

A More Intuitive Look at Quarterly GDP
I’ll close with one more look at quarterly GDP — the year-over-year percent change, which is certainly more intuitive than the conventional practice of the Bureau of Economic Analysis of calculating GDP by compounding the quarterly percent change at annual rates (which they explain here). Consider: the three quarters of 2014 GDP using the BEA’s preferred method are -2.1%, 4.6% and 5.0%. The year-over-year change in the three quarters is a much less attention-grabbing 1.9%, 2.6% and 2.7%. When we use the more intuitive percent change from a year ago, we get a somewhat disturbing long-term perspective on where we are in the grand scheme of things, one the more closely resembles the moving average in the chart above.

On Wednesday we’ll find out how the Q1 forecasts stack up against the Advance Estimate of the real thing.


