

By valueplays. Originally published at ValueWalk.
The Worst Recovery in 70 Years ???
“Davidson” submits:
This observation may not prove overly useful to you in the short term, but I think it is worth while seeing where we are economically now that we have data going back 60yrs + which is relatively reliable. The 1st is from an editorial headline today in the WSJ, “The Six-Year Slough”, “New GDP revisions show the worst recovery in 70 years was even weaker.” The 2ndcomes from comments celebrating Milton Friedman’s contributions to economic thinking. Had he lived he would have celebrated his 103 birthday this past week. Unfortunately neither has empirical support.
First, the WSJ is grossly mistaken in claiming that US growth today is worse than it has been the past 70yrs-see their chart below. What they did was to compare GDP today with GDP in prior periods. GDP in the past is grossly distorted by inflation. If GDP is not corrected for inflation, the comparisons are not valid. One must compare Real GDP to produce valid comparisons. One must use Real GDP to make historical comparisons.
Chart 1: From the Wall Street Journal “The Six-Year Slough”
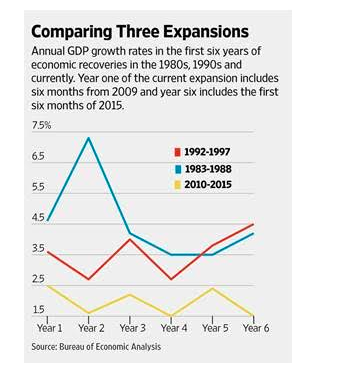
Worst Recovery
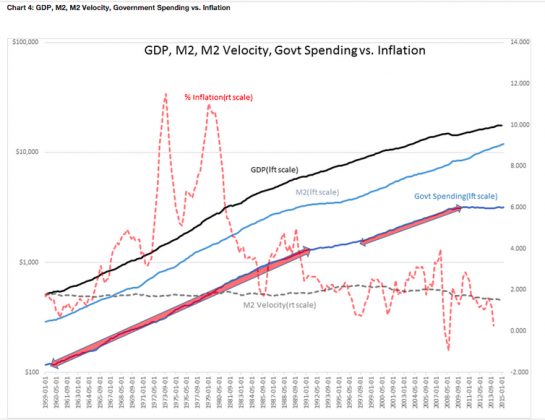
The Real GDP history is shown in Chart 2: Real GDP Percent Annually with a trend line. Real GDP in the 1980s was about 3.2%. The 7%+ value in Chart 1 includes inflation. US Real GDP has grown from $1.2tril to over $16tril today. Our Real GDP trend is impacted by the law of large numbers, i.e. the larger something is, the slower it tends to grow. The trend line places US Real GDP growth just under 3% annually today. Yes, we are underperforming the historical norm. Part of this is due to an underperforming housing sector, but a crucial element of underperformance is due to government spending.

Worst Recovery
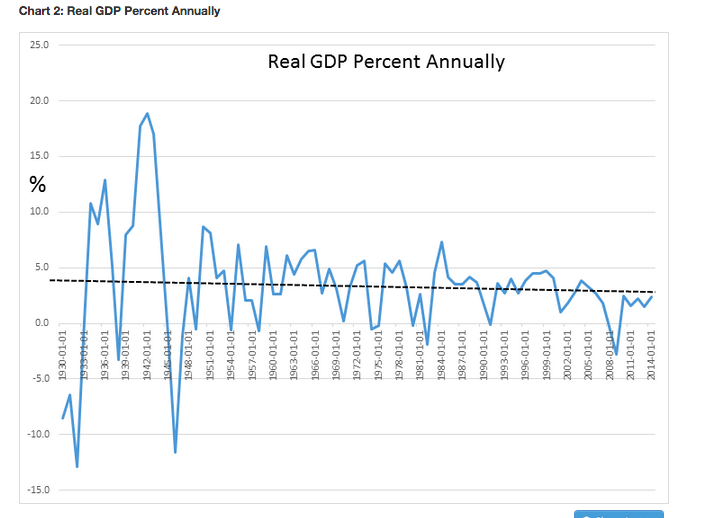
Chart 3: US Real GDP vs. Total Govt Expenditure&Investment shows today’s Real Private Economy which is US Real GDP – Total Govt Expenditure& Investment = Real Private Economy.Total Govt Expenditure& Investment is a component of US Real GDP and one needs to subtract it our to get a clear picture of the Private Economy. Our Private Economy today is growing about 3.34% and roughly equal to our previous recovery. The slowness in US Real GDP today vs. our last recovery is mostly due to slowing Total Govt Expenditure & Investment.

worst recovery
We are decidedly not in the worst recovery in 70yrs” even if every one seems to believe it so. One wonders what methods our finest universities are using to teach critical thinking.
Now, drop down to my observation on Friedman’s widely believed connection between money growth and inflation.
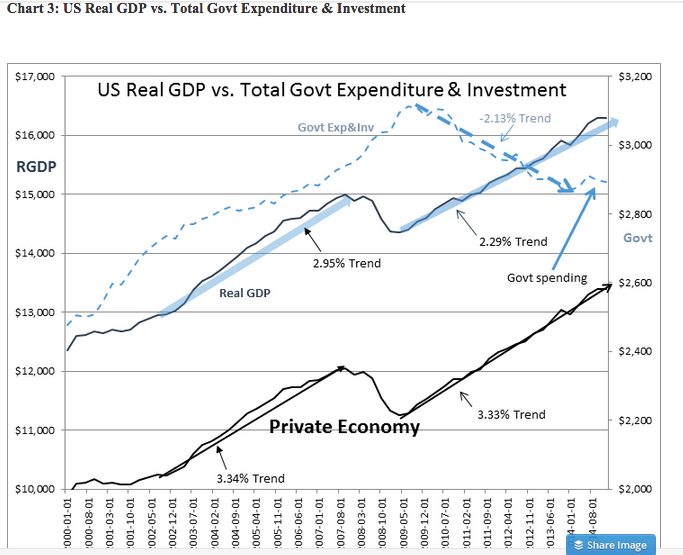
Milton Friedman will always be widely regarded, but not every observation of every great man has ever proven correct when put to the test of time. The same holds here. If one compares GDP, M2(money supply), M2 Velocity(turnover of money supply), Government Spending vs. Inflation-see Chart 4: GDP, M2, M2 Velocity, Government Spending vs. Inflation- some interesting patterns are revealed especially if one adds in historical readings as to how Government spends taxpayer money.
What can be seen is a relationship that is contrary to Milton Friedman’s famous quote that “Inflation is always and everywhere a monetary phenomenon.” Over many years it has been said that excess M2 is inflationary. It has also been said that higher M2 Velocity is inflationary. In the chart below the only obvious relationship with inflation is higher government spending. The connection between inflation and government spending is fairly obvious. The RED ARROWS show the rises in government spending which correlate to rises in inflation. When government spending slows, disinflation follows. Since mid-2010 this connection is clearly seen with government spending going flat while M2 continues to rise. The Fed has been pushing hard to raise M2 to increase inflation, but inflation instead is following government spending. If M2 and inflation were correlated we should have inflation today much higher than we do.
worst recovery
Friedman did say however that, “Nobody spends somebody else’s money as carefully as he spends his own. Nobody uses somebody else’s resources as carefully as he uses his own. So if you want efficiency and effectiveness, if you want knowledge to be properly utilized, you have to do it through the means of private property.” And also that, “The government solution to a problem is usually as bad as the problem.”
Government spending comes with a sense of purpose not of profitability. There are literally thousands of stories of government contracts proving highly profitable to contractors at the expense of taxpayers. Government is not known for spending taxpayer money frugally. This has been true for years. It is this type of spending which creates a rise

Sign up for ValueWalk’s free newsletter here.


