

Courtesy of Doug Short’s Advisor Perspectives.
Note: The charts below have been updated to include today’s preliminary report on U.S. Light Vehicle sales from Motor Intelligence.
For the past few years we’ve been following a couple of transportation metrics: Vehicle Miles Traveled and Gasoline Volume Sales. For both series we focus on the population adjusted data. Let’s now do something similar with the Light Vehicle Sales report from the Bureau of Economic Analysis. This data series stretches back to January 1976. Since that first data point, the Civilian Noninstitutional Population Age 16 and Over (i.e., driving age not in the military or an inmate) has risen about 63%.
Here is a chart, courtesy of the FRED repository, of the raw data for the seasonally adjusted annualized number of new vehicles sold domestically in the reported month. This is a quite noisy series, to be sure. The absolute average month-over-month change is 4.4%.
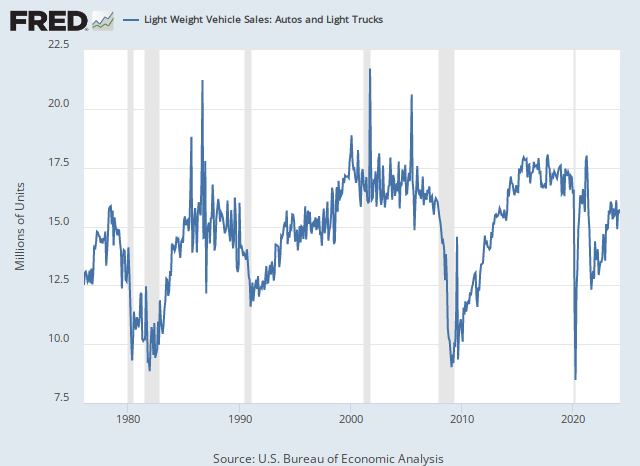
The latest data point is the preliminary June count published by Motor Intelligence, which shows a seasonally adjusted annual rate of 16.66 million units, which is a 4.2% decrease from the previous month.
The first chart shows the the series since 2007, which illustrates the dramatic impact of the Great Recession. The blue line smooths the volatility with a nine-month exponential moving average suggested by my friend Bob Bronson of Bronson Capital Markets Research. The moving average reduces the distortion of seasonal sales events (e.g., Memorial Day and Labor Day weekend) and thus helps us visualize the trend.

Here is a the complete series data from 1976. We’ve added a linear regression (the red line) is added to further illustrate the direction of the long-term trend.

In the chart above, the latest moving average value is 3.6% below its record high in 2005.
Here is the same chart with two key modifications:
- We’ve created a per-capita version using the FRED’s CNP16OV series for the adjustment.
- We’ve indexed the numbers so that the first data point, January 1976, equals 100.

The moving-average for the per-capita series peaked in 1986. Twenty-nine-plus years later, it is now down 27.6% from that 1986 peak.
The good news is that this adjusted metric has continued to rise from its Great Recession historic low, and it is comfortably above the linear regression. It will be interesting to see if the post-recession growth continues in the years ahead.


