

Courtesy of Doug Short’s Advisor Perspectives.
This morning’s release of the July New Home Sales from the Census Bureau came in at 654K, up 12.4% month-over-month from a revised 582K in June. Seasonally adjusted estimates for April and May were revised. The Investing.com forecast was for 580K.
Here is the opening from the report:
Sales of new single-family houses in July 2016 were at a seasonally adjusted annual rate of 654,000, according to estimates released jointly today by the U.S. Census Bureau and the Department of Housing and Urban Development. This is 12.4 percent (±12.7%)* above the revised June rate of 582,000 and is 31.3 percent (±19.9%) above the July 2015 estimate of 498,000.
The median sales price of new houses sold in July 2016 was $294,600; the average sales price was $355,800. The seasonally adjusted estimate of new houses for sale at the end of July was 233,000. This represents a supply of 4.3 months at the current sales rate. [Full Report]
For a longer-term perspective, here is a snapshot of the data series, which is produced in conjunction with the Department of Housing and Urban Development. The data since January 1963 is available in the St. Louis Fed’s FRED repository here. We’ve included a six-month moving average to highlight the trend in this highly volatile series.
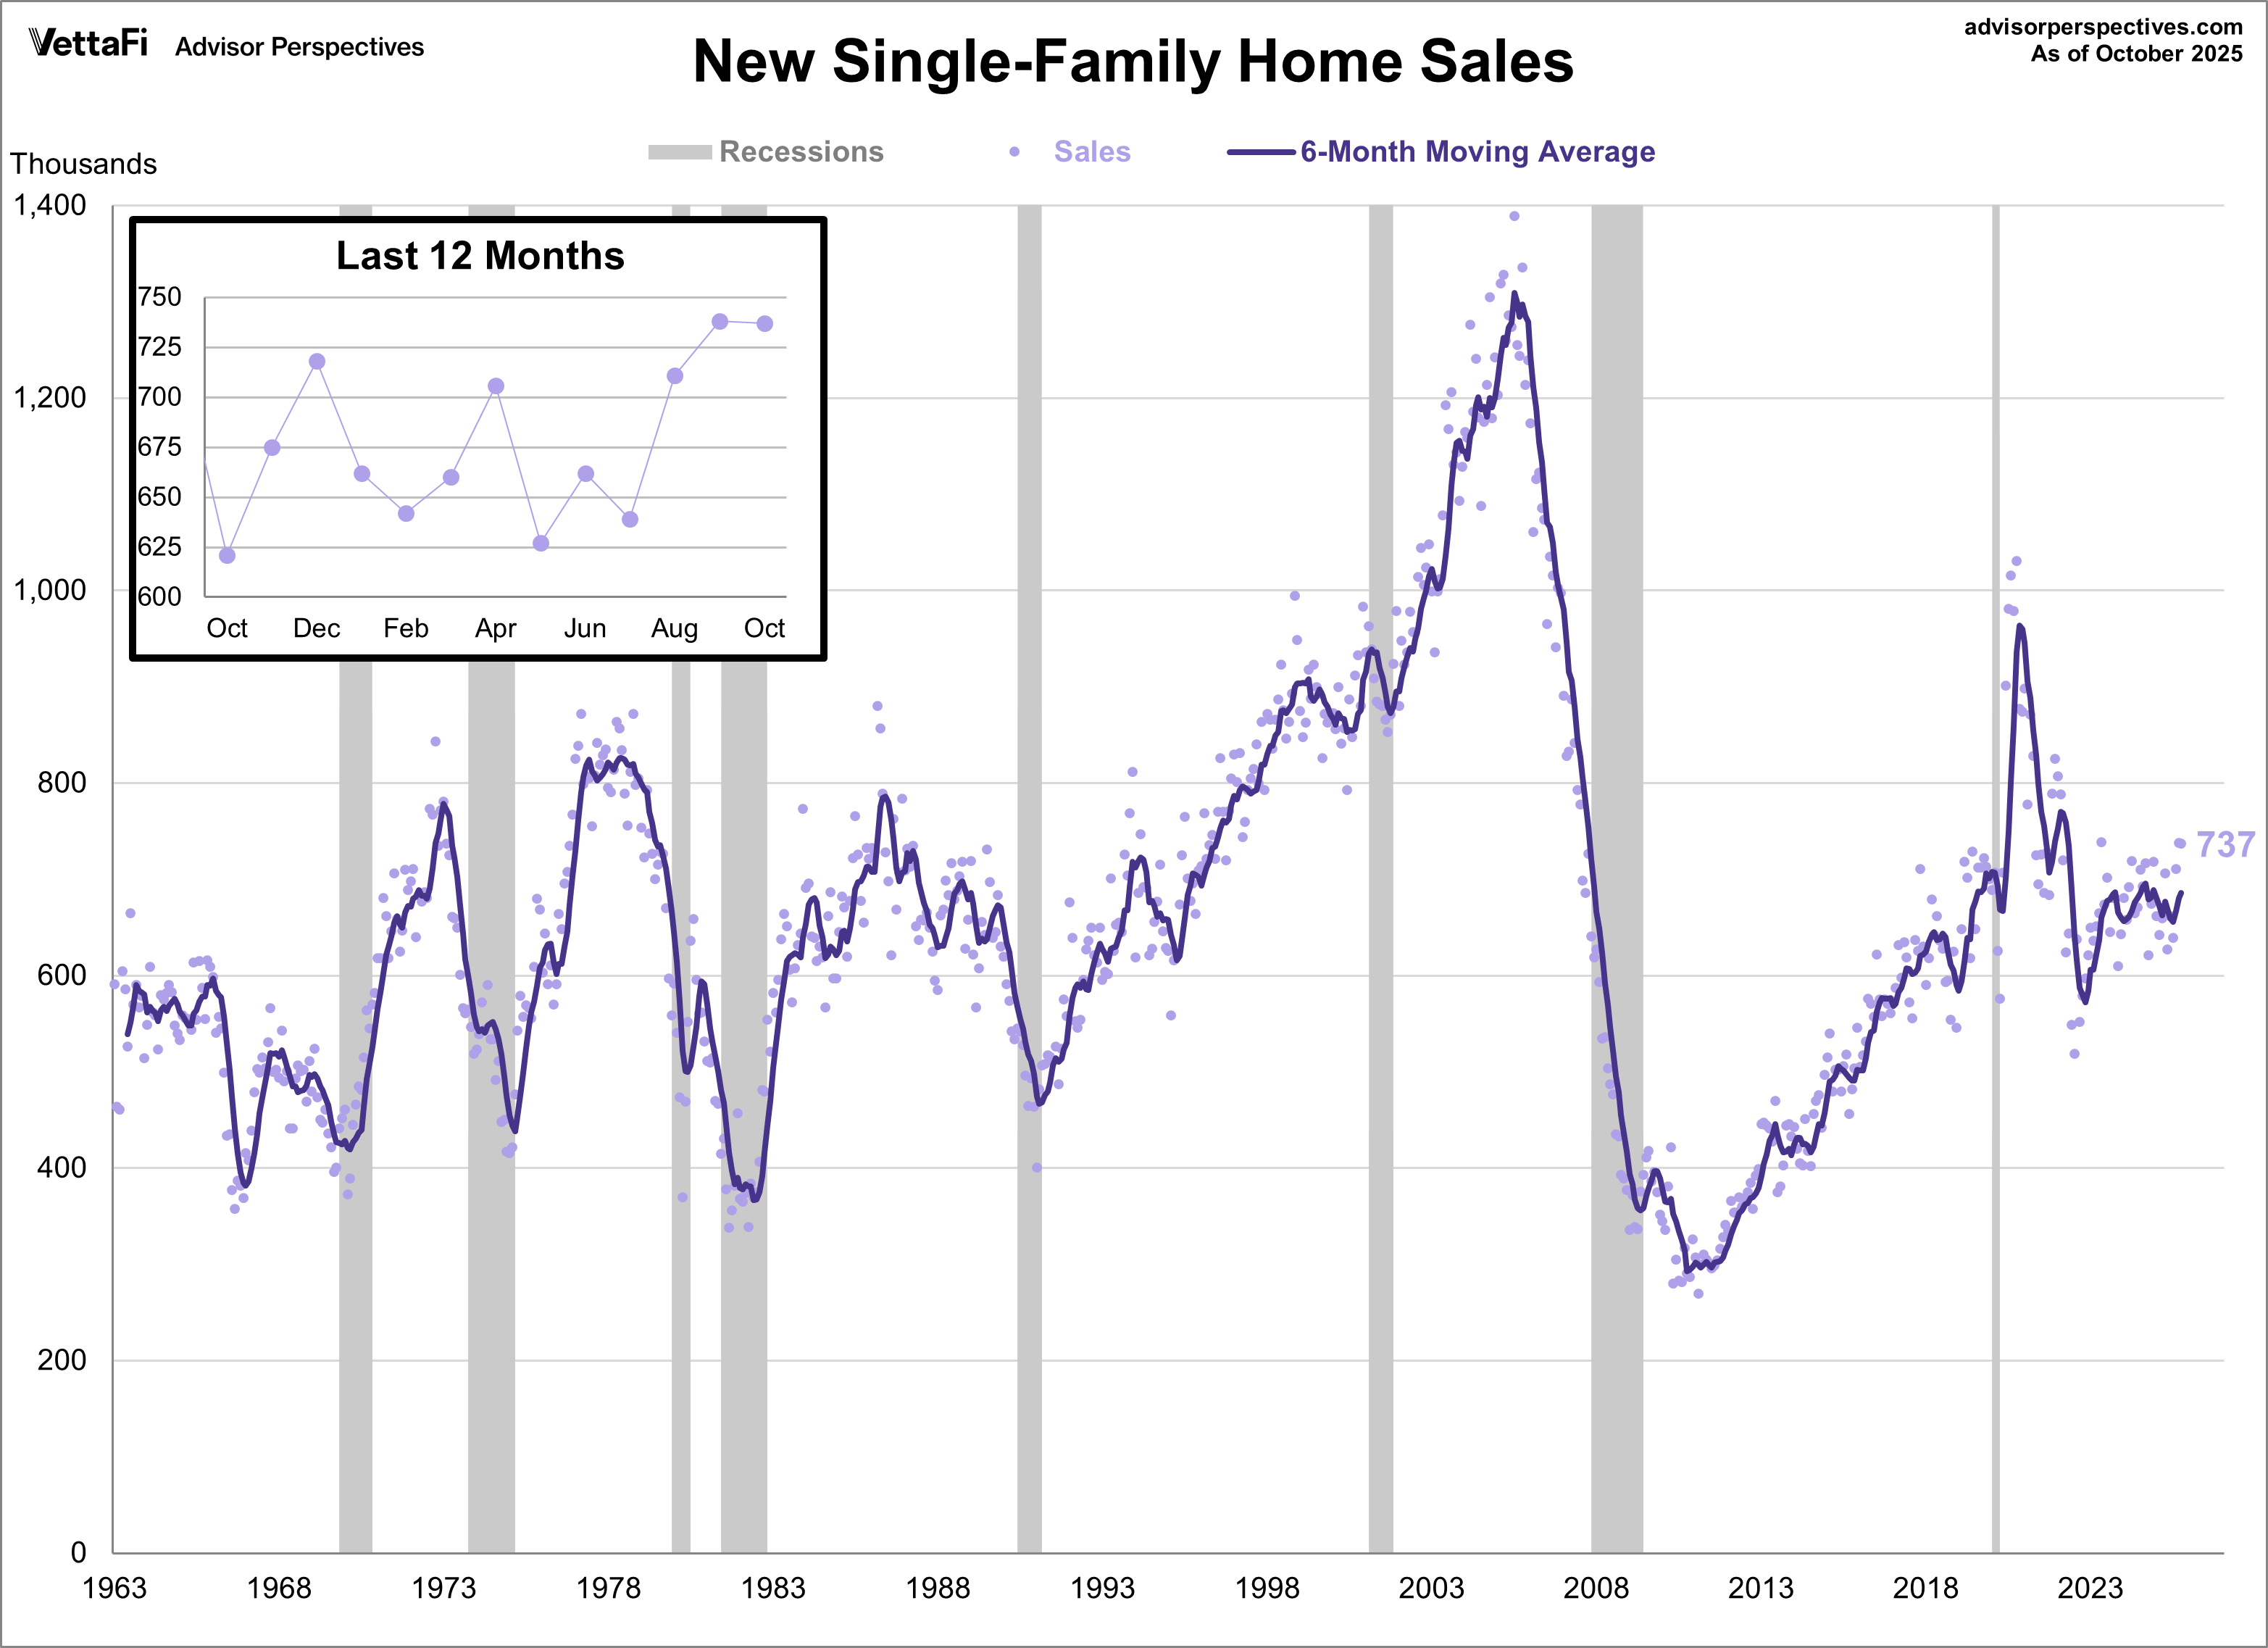
Over this time frame we see the steady rise in new home sales following the 1990 recession and the acceleration in sales during the real estate bubble that peaked in 2005.
The Population-Adjusted Reality
Now let’s examine the data with a simple population adjustment. The Census Bureau’s mid-month population estimates show a 72.4% increase in the US population since 1963. Here is a chart of new home sales as a percent of the population.

New single-family home sales are about 10.7% above the 1963 start of this data series. The population-adjusted version is 35.8% below the first 1963 sales and at a level similar to the lows we saw during the double-dip recession in the early 1980s, a time when 30-year mortgage rates peaked above 18%. Today’s 30-year rate is around 4%.
For another perspective, here are the median new home sale prices back to 1963, inflation adjusted.

Here’s a zoomed in look since 2000.

For additional perspectives on residential real estate, here is the complete list of our monthly updates:


