

By Gabriel Thoumi, CFA, FRM. Originally published at ValueWalk.
The Trump BackTracker is a new, regularly updated analysis of all of climate policies on the books and in the pipeline at the end of the Obama administration – ranked by how vulnerable they are to backtracking by the Trump administration, and what that means for U.S. climate pollution trajectory.

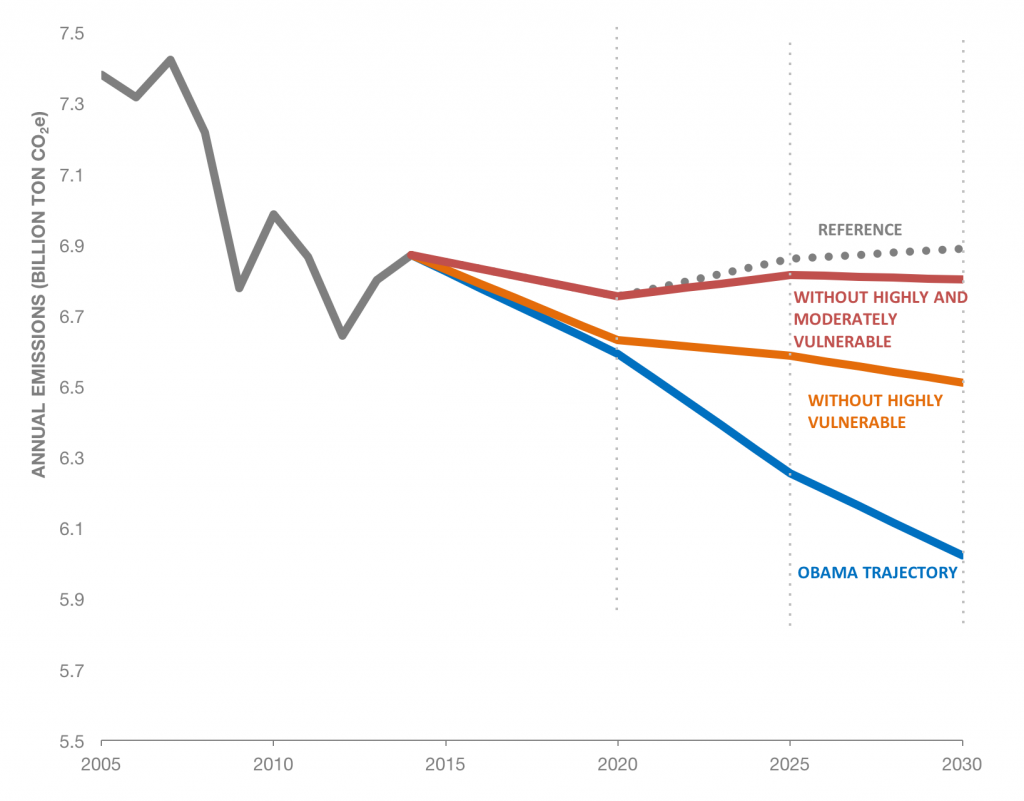
Climate Adviser’s first update to the Backtracker looks at where things stand near the end of President Trump’s first 100 days in office. Trump BackTracker found that the “Trump Effect” really begins to bite into the U.S. emissions trajectory in 2025 – since many of the factors influencing today’s emissions trajectory cannot be reversed quickly.
Emissions Trajectory Without Sinks
Trump BackTracker Introduction
The Trump Effect could mean over half a gigaton more climate pollution in 2025. That is about the same as the emissions from electricity use for 60 percent of the homes in the entire country. Of the Obama 2015 climate goals, a whopping 332 million metric tons (mmt) of climate pollution cuts in 2025 – or 55 percent – currently come from policies that may be highly vulnerable. 229 million tons, or 38 percent, come from moderately vulnerable policies. And just 7 percent of potential emissions cuts, or 45 mmt, are relatively safe and just rated “vulnerable.”
The policy-by-policy analysis, and visualizations that put the impacts in context, are all available and will be updated at www.climateadvisers.com/trumpbacktracker.
Policy Vulnerability Assessment
We looked at new and updated policies in the power sector, transport sector, buildings and appliances, methane sources and hydrofluorocarbons in place at the end of the Obama Administration.3 Then, we looked at how vulnerable these policies are to rollback through one or more mechanisms available to the Trump administration. We found that the vast majority of Obama-era climate regulations are vulnerable to rollback, in three tiers.
Highly Vulnerable: These include well-known and controversial rules such as the Clean Power Plan (CPP) and the new source performance standards to limit methane emission for new oil and gas facilities.
Highly vulnerable rules include:
- Clean Power Plan
- Hearth Products
- Residential Furnaces
- Residential Convention Cooking Products
- General Service Lamps
- Commercial Water Heaters
- Ceiling Fans
- Methane Target
- New Source Performance Standards for New Oil and Gas Facilities
- Standards to Reduce Venting and Flaring From Oil and Gas Production on Public Lands
Moderately Vulnerable: This category comprises the majority of all existing climate policies, especially those eligible for disapproval under the CRA. Here, we also include HFC emissions reductions mandated by the recently concluded amendment to the Montreal Protocol. Although the amendment is not as visible and contentious as the Paris Agreement—and increased reliance on HFC alternatives could be a boon for the U.S. companies that manufacture them—participation in any international body, especially one that requires a contribution of funds, will likely come under scrutiny in the Trump administration.
Moderately vulnerable rules include:
- Ceiling Fan Light Kits
- Battery Chargers
- Residential Humidifiers
- Portable Air Conditioners
- Commercial Boilers
- Back-Up Power Supplies
- Updated Performance Standards for Municipal Solid Waste Landfills
- Montreal Protocol Phasedown
- Refrigerant Management Requirements
- SNAP Status Change Rule 21
Vulnerable: Regulations that are likely safe are those that cannot be easily reversed through the CRA and/or those that were concluded as a result of negotiated rulemaking (i.e., in partnership with multiple stakeholders, including industry, government and civil society).
Vulnerable rules include:
- CAFE Standards for Heavy Vehicles Post-MY2018
- Commercial Clothes Washers
- Wine Chillers & Other Beverage Coolers
- Residential Central Air Conditioners & Heat Pumps
- Pool Pumps
- Walk-in Coolers and Freezers
For each policy, we include the expected greenhouse gas mitigation potential of the action, as estimated by the Environmental Protection Agency (EPA), Department of Energy (DOE) or another relevant agency, through 2030. Click here for a PDF cheat sheet listing all of these policies, ranked by vulnerability and showing potential climate impact.
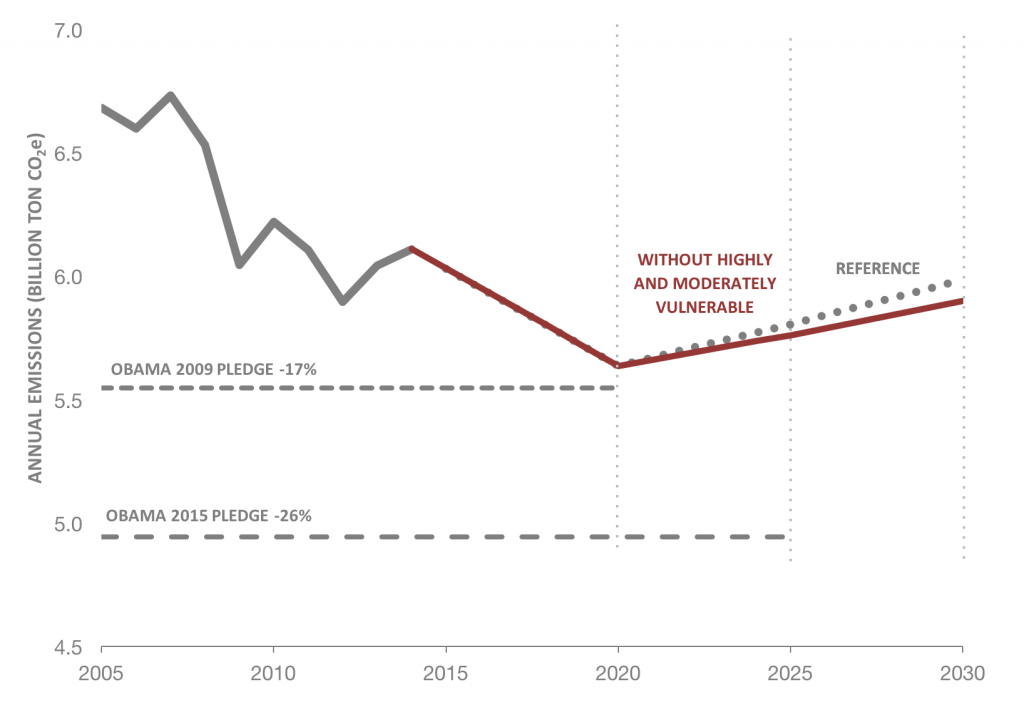
Projected Emissions: After Reversing Highly and Moderately Vulnerable Policies
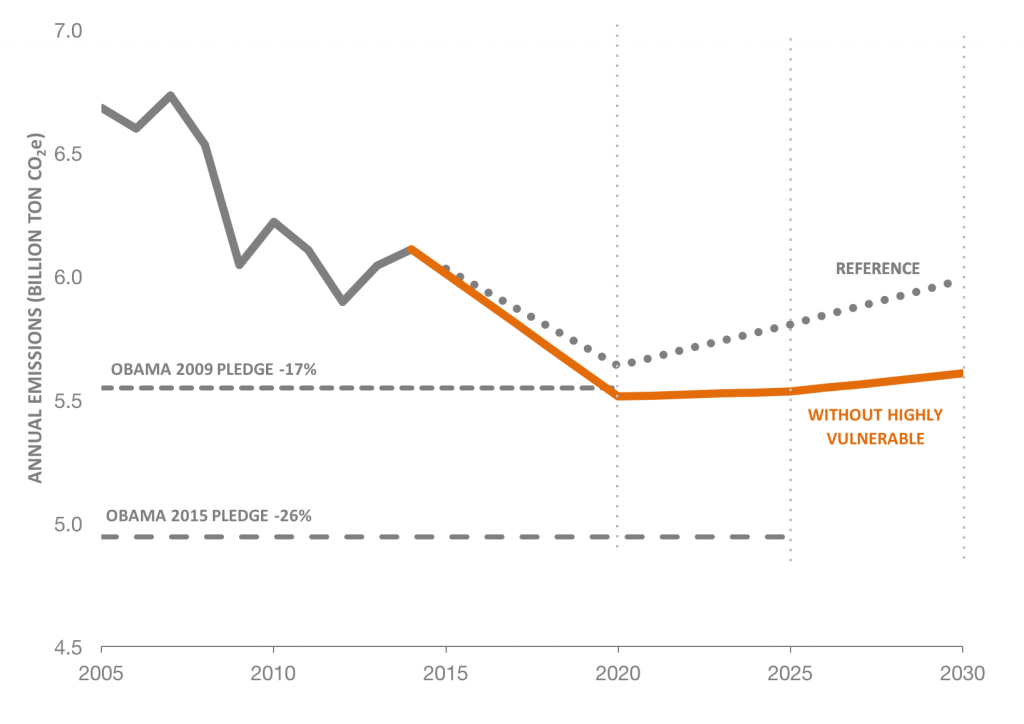
Projected Emissions: After Reversing Highly Vulnerable Policies
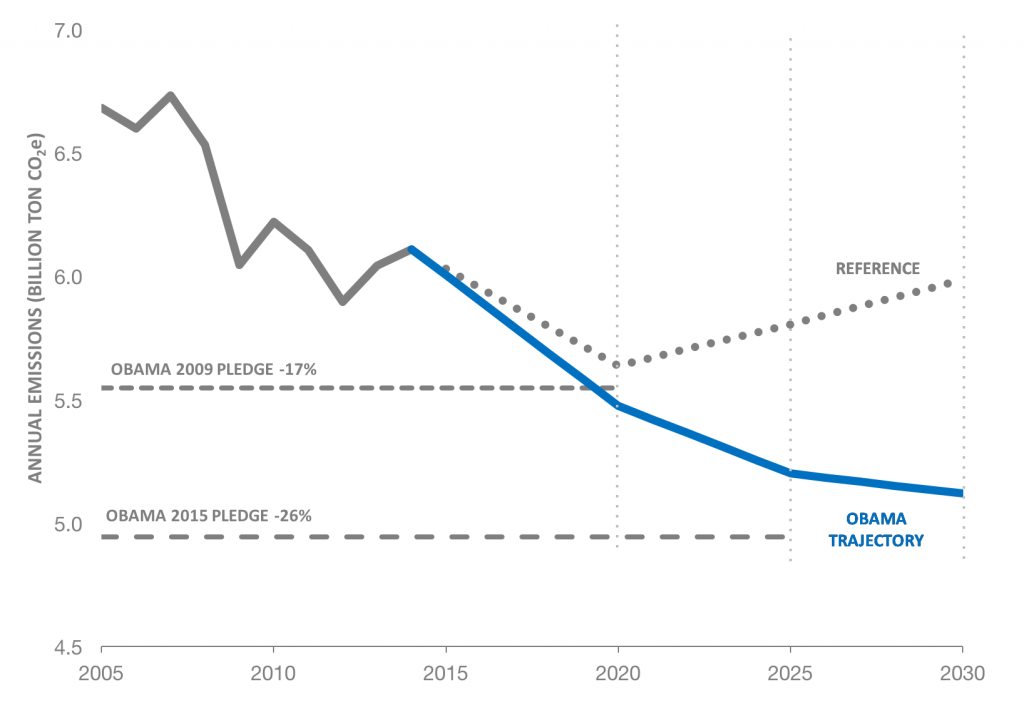
Projected Emissions: Maintaining Obama Policies
Reference Case Calculations
U.S. Business-as-Usual (BAU) emissions include the projected release of six gases:
- Carbon dioxide (CO2)
- Methane (CH4)
- Nitrous oxide (N2O)
- Hydrofluorocarbons (HFCs)
- Perfluorocarbons (PFCs)
- Sulphur hexafluoride (SF6)
CO2 natural carbon sinks are also included in this analysis.
BAU is measured taking 2014 as the base year, and includes implemented policies such as MY 2022-2025 CAFE standards that may change if EPA weakens these standards after mid-term review. The high and low BAU scenarios, in million metric tons of CO2 equivalent (million metric tons CO2e), are provided below.
Projected Greenhouse Gas Emissions Through 2030 (MMTCO2-eq)
| Pollutant: | 2005 | 2014 | 2020 | 2025 | 2030 |
| CO 2 | 6,123 | 5,556 | 5,477 | 5,525 | 5,531 |
| CH 4 | 717 | 731 | 670 | 674 | 682 |
| N 2 O | 398 | 404 | 338 | 335 | 334 |
| HFC | 120 | 167 | 255 | 311 | 324 |
| PFC | 7 | 6 | 5 | 5 | 7 |
| SF 6 | 14 | 7 | 9 | 9 | 10 |
| NF 3 | 0.5 | 0.5 | |||
| Sinks – low | -699 | -762 | -1,044 | -908 | -689 |
| Sinks – high | -699 | -762 | -1,191 | -1,201 | -1,118 |
| Net GHGs – low | 6,680 | 6,108 | 5,563 | 5,658 | 5,770 |
| Net GHGs – high | 6,680 | 6,108 | 5,710 | 5,951 | 6,199 |
Note: Historic emissions obtained from EPA’s Greenhouse Gas Inventory 1990-2014.
- Carbon Dioxide: Future U.S. carbon dioxide emissions are estimated based on the U.S. Energy Information Administration’s 2016 Annual Energy Outlook (2016 AEO), using the reference scenario without the Clean Power Plan. The projections account for all federal and state regulations implemented as of the end of February 2016. The energy-related CO2 emissions figures obtained from the 2016 AEO are adjusted upward to obtain a rough estimate of total CO2 emissions. We use a 1.03 adjustment factor, which roughly represents the historic ratio between total and energy-related CO2 emissions in the United States.
- CH4, N2O, HFCs, PFCs, and SF6: Projected U.S. emissions of the remaining five gases are taken from the Second U.S. Biennial Report to the UNFCCC and represent the “current policies” scenario. These estimates have been developed by the U.S. Environmental Protection Agency and take into account policies under implementation as of mid-2015.
- Land sinks: The volume of CO2 removals by U.S. land sinks, particularly forests, are the largest source of uncertainty in future GHG emissions. Historically, this figure has been significant—for example, land sinks offset approximately 15 percent of total emissions in each of the past five years. Although it is possible that U.S. forests will continue this high rate of carbon sequestration through 2025 and beyond, some studies now indicate that the CO2 absorption rate may begin to decline due to increased forest disturbances (e.g., drought, wildfires and the spread of diseases), slower forest growth, and other factors. To account for this variability, the Second Biennial Report provides both a low and high carbon sequestration figure. Both are including in our calculations.
Emissions Trajectory Without Sinks
Our projections for carbon dioxide removals by natural land sinks are taken from the U.S. Second Biennial Report (SBR) to the UNFCCC, published in early 2016. Since then, the U.S. EPA has substantially revised its methodology for calculating historic sinks. We are not aware whether or not the revised methodology is consistent with that used to estimate future sinks in the SBR. Because the two may not in fact be consistent, the _net_ emissions graphic may misrepresent the degree to which the U.S. is meeting its climate commitments, all of which are based on net emissions. Gross emissions remove the uncertainty related to the land sink and allow us to more clearly visualize how projected emissions compare with historic totals.
Calculation Tools for Below Reference Case
We obtain the total abatement potential of policy action by adding up the projected impact of all active policies within a given year. This sum is then subtracted from the reference case emissions projections. Expected reductions are
The post “Trump Effect” Bites Into U.S. Emissions Trajectory By 2025: 26 Different Policies Analyzed appeared first on ValueWalk.
Sign up for ValueWalk’s free newsletter here.


