

Courtesy of Declan.
The ‘most hated’ rally, started in 2009, suffered a potential setback with wide range (neutral) candlesticks across markets. How much the UK election result played on this remains to be seen but Friday’s trading marked a day of chaos. Shorts should not be jumping so much for joy. The rally for the past few months has taken indices to a point where a 25% loss – a definition for a bear market – would only see tests of February’s lows in 2016 (and nowhere near a test of 2009 lows or anything later).
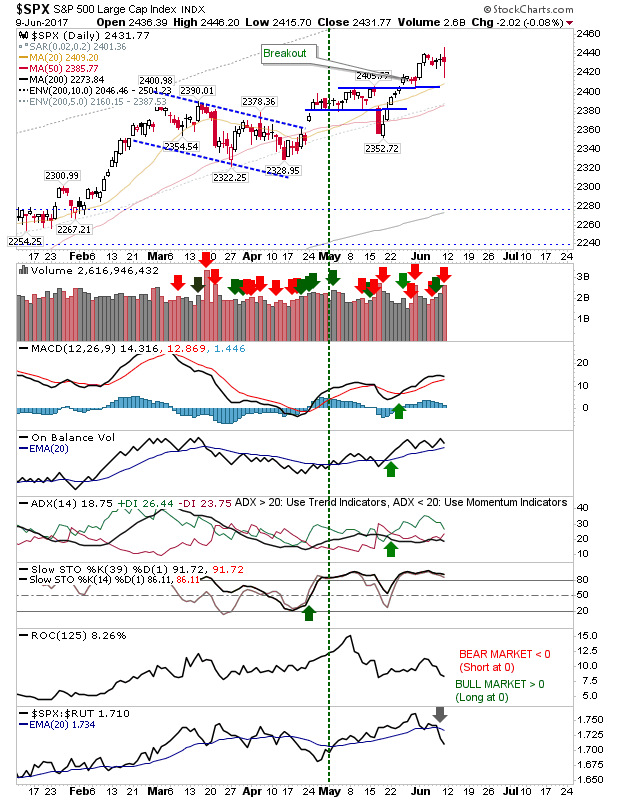
The S&P experienced higher volume distribution as the day closed with a ‘spinning top’. Next week will be about consolidating the action in the context of Friday’s close and holding the breakout. Technicals remain positive
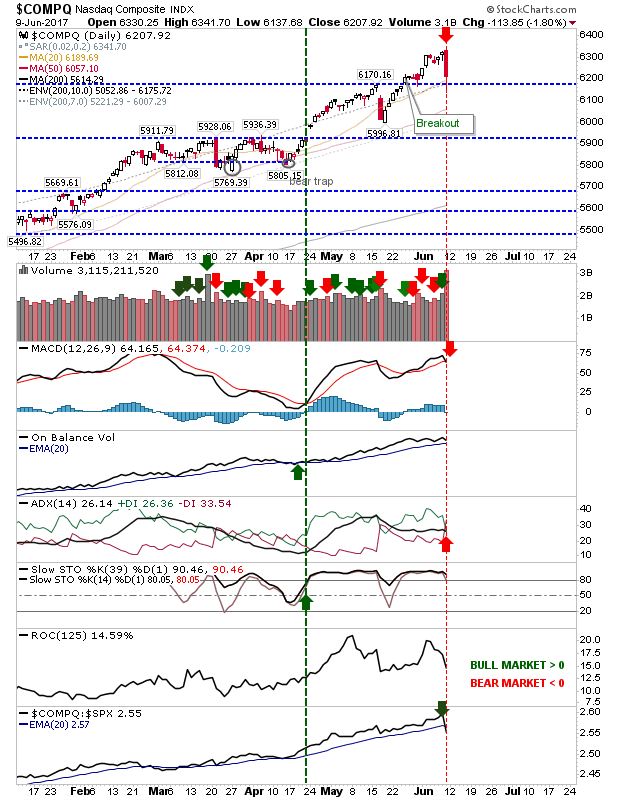
The Nasdaq suffered a near 2% loss, which looked a lot worse in the context of tight trading over the past 6 months. This also led to ‘sell’ triggers in the MACD and ADX; not to mention a significant reversal in relative performance. While the selling was nasty, it hasn’t knocked (yet) the rally out of its stride. Next week will be about preserving the breakout. Don’t be surprised if there is a brief drop below 6,200 before an end-of-week finish above this support level.
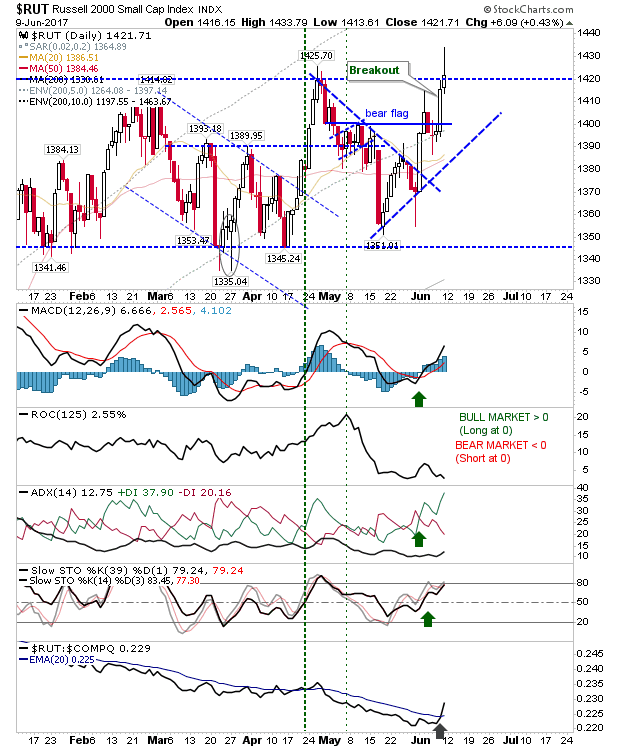
I was impressed with the Russell 2000. This underperforming index was able to hold some of its Friday gain (as all fell around it). This provided a healthy boost in relative performance, leaving the index just shy of a trading range breakout of 1,420 with solid technical strength. Longs should watch this index for leads early next week.
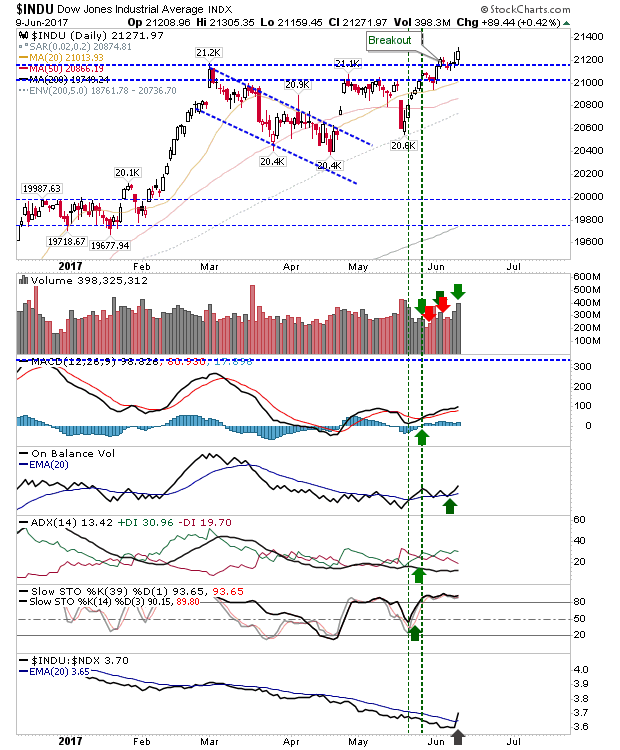
I had talked a couple of weeks ago about the Dow Jones Average been primed for a breakout. As other indices struggled, the Dow posted a clear breakout on higher volume accumulation. With momentum buyers having fewer options to work with, this – and the Russell 2000 – could be the indices to deliver in the weeks to come.
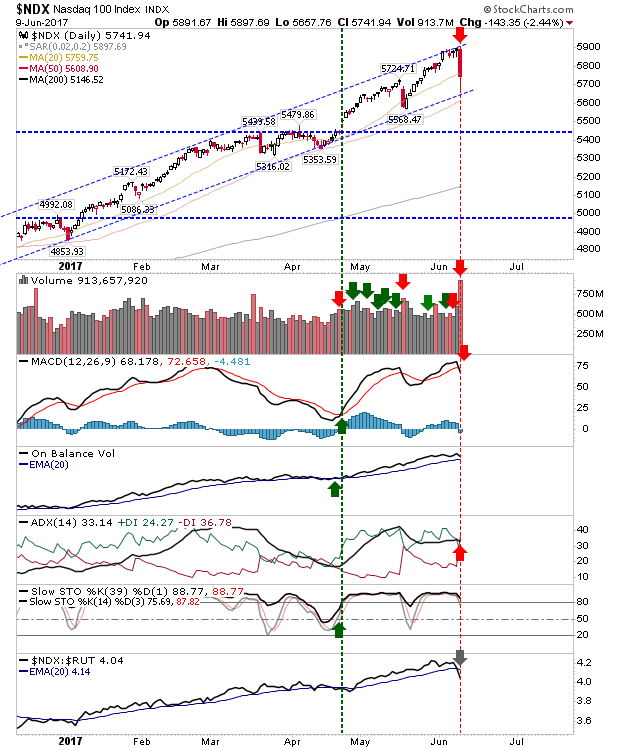
Some more aggressive shorts will be holding good gains in the Nasdaq 100. It came off resistance after a few days of tight action. Volume surged in significant distribution. Profit taking / short covering should kick in once lower channel support is tagged.
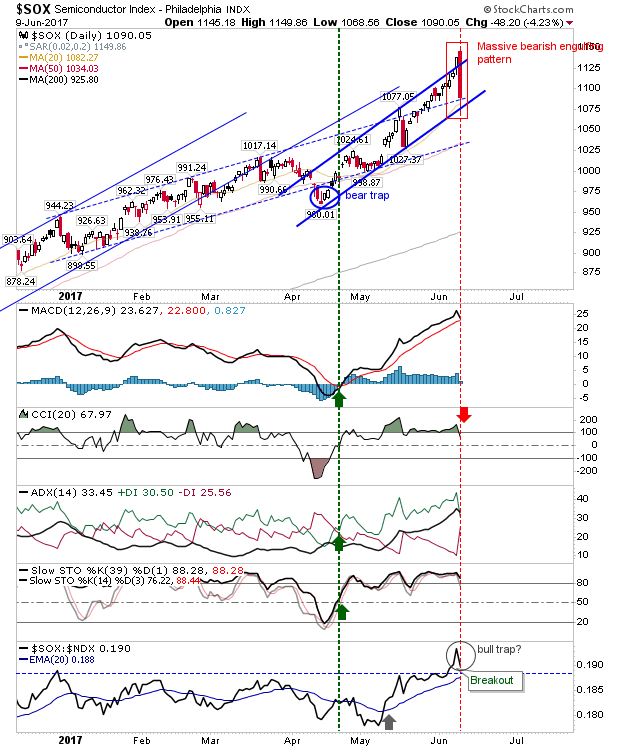
The greatest selling occurred in the Semiconductor Index. A massive 4%+ loss was accompanied by a bearish engulfing pattern. What could be key here is whether the breakout in relative performance against the Nasdaq 100 morphs into a ‘bull trap’.
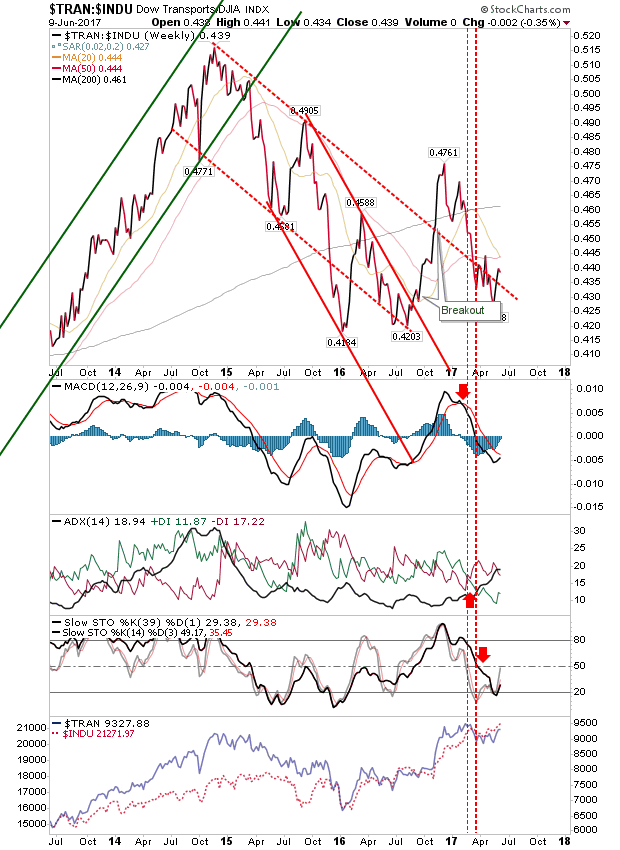
I’m keeping an eye on the long term charts. The Dow Theory watch is pointing to continued struggles as the relationship between the parent Dow Jones Index and Dow Jones Transports flounders. This is 3 year+ bear market which is bad news for economy watchers and equity shareholders. The Dow Jones index may be flying, but Transports (the carriers of goods) have been left far behind.
Next week will be about returning stability to the markets. Bulls can look to buying a breakout in the Russell 2000 or trading the new breakout in the Dow Jones. Pessimists can look to short recovery rallies in the Tech Indices. The S&P is a hold until more information is available; e.g. the breakout fails.
You’ve now read my opinion, next read Douglas’ blog.
I trade a small account on eToro, and invest using Ameritrade. If you would like to join me on eToro, register through the banner link and search for “fallond”.
If you are new to spread betting, here is a guide on position size based on eToro’s system.


