

Courtesy of Declan.
Friday saw a nice little finish for markets with the Nasdaq, Nasdaq 100, Semiconductor Index and S&P all doing well as strong earnings from multinationals keep the rally chugging along. The only index to remain on the outside was the Russell 2000 as it continued to map its ‘bull flag’.
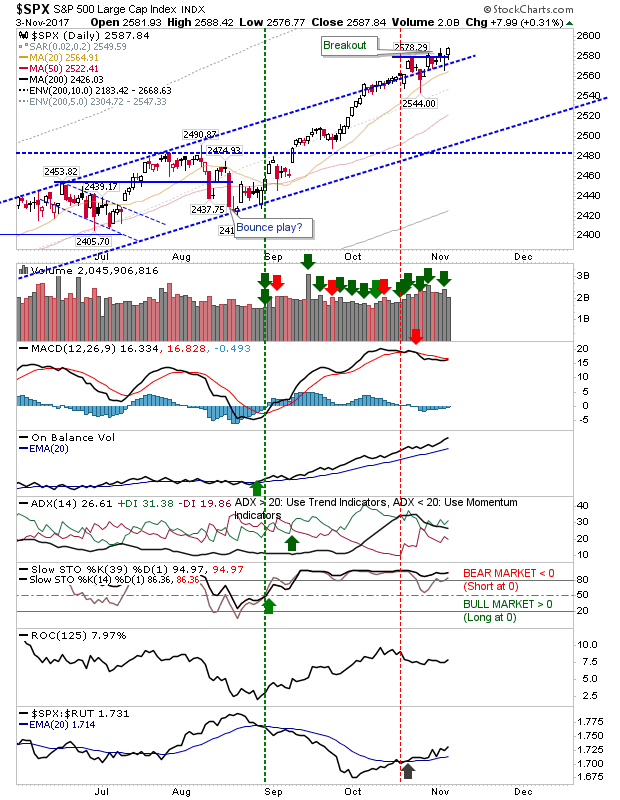
The S&P reaffirmed its breakout after looking like it had topped out. Keep an eye on the MACD as it sits on the verge of a new ‘buy’ trigger well above its bullish zero line; On-Balance-Volume is also performing strongly. A pop like it enjoyed in late September would not be surprising.
The Russell 2000 offered little of note and was largely ignored by traders.

The Nasdaq negated its bearish cloud cover on lighter volume. However, it didn’t undo its On-Balance-Volume ‘sell’ trigger although other technicals are healthy.

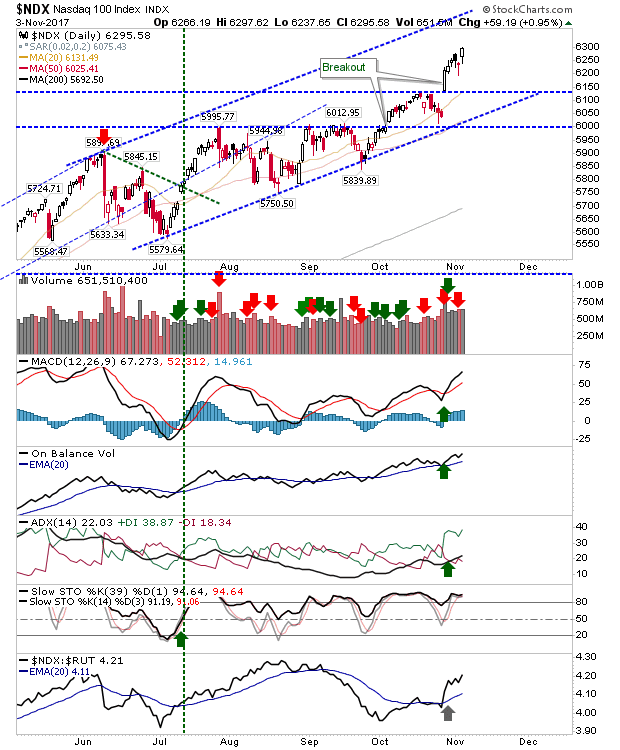
The Nasdaq 100 also enjoyed a good Friday as it marked a new closing high on solid technical strength.
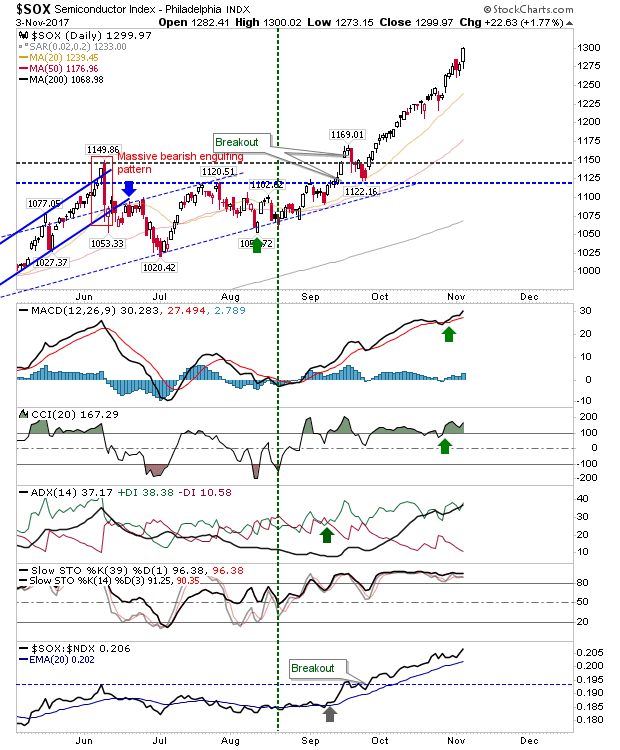
Both Tech indices benefitted from the gains in the Semiconductor Index. This index has effectively enjoyed a continued rally since August and Friday’s action along with supporting technicals suggest there is more to follow.
If there is a concern it’s that Nasdaq breadth has been in decline since mid-October and Friday’s gains did not arrest this. The Nasdaq Summation Index even turned net bearish (in technical strength) as the Nasdaq itself was pushing new highs. This marks a significant bearish divergence.

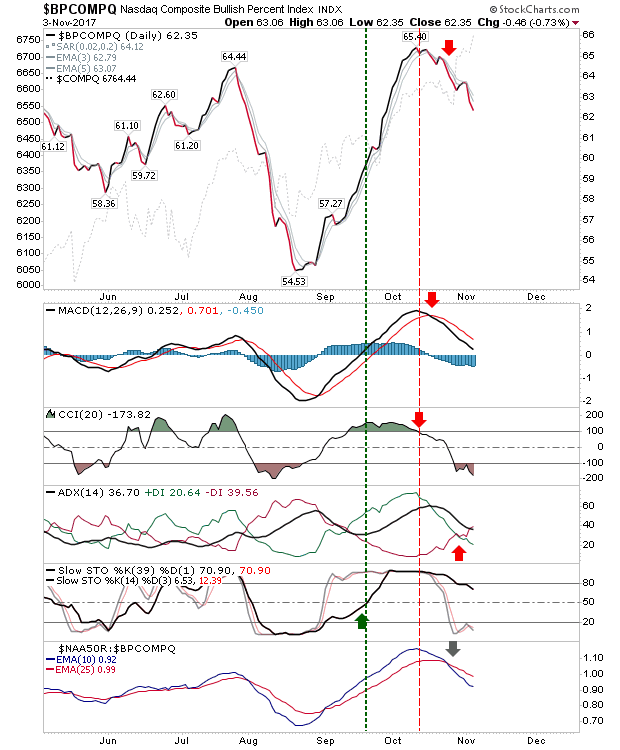
The Bullish Percents (percentage of Nasdaq stocks on Point-n-Figure ‘buy’ signals) also peaked mid-October and technicals remain weak.
The Percentage of Nasdaq Stocks above its 50-day MA also peaked mid-October. This particular breadth metric can be quite erratic but it’s singing the same tune as its peers here.
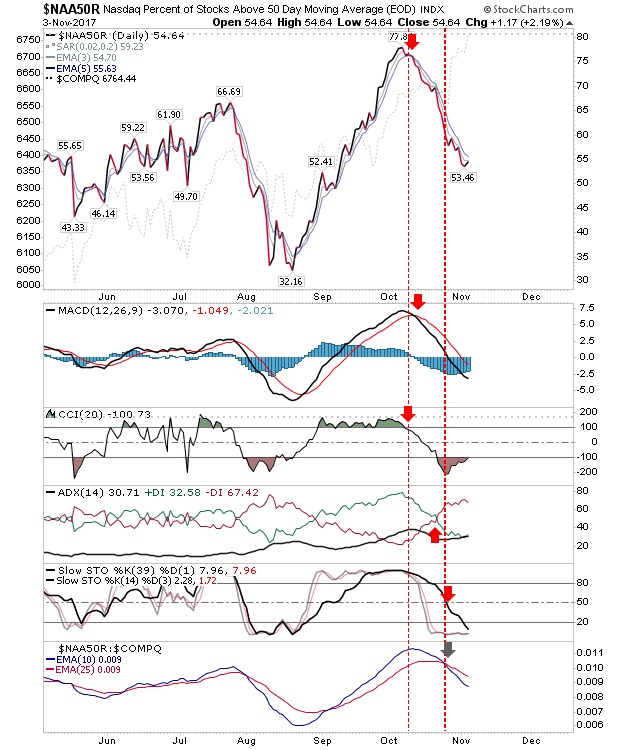
With this contradiction between three different Nasdaq breadth metrics and the Nasdaq itself one must be prepared for some downside in the parent index sooner rather than later. Those looking to buy, even if it’s just a pullback, should wait for breadth metrics to become oversold or when there is a new ‘buy’ signal across all three indices. Personally, I find the Nasdaq Summation Index to give the clearest signal and probably should be a primary focus for the next ‘buy’ signal.
You’ve now read my opinion, next read Douglas’ blog.
I trade a small account on eToro, and invest using Ameritrade. If you would like to join me on eToro, register through the banner link and search for “fallond”.
If you are new to spread betting, here is a guide on position size based on eToro’s system.


