Click here for a FREE, 90-day trail subscription to our PSW Report!
Trading the Russell 2000
Courtesy of Allan
It appears from my testing that one particular trading vehicle consistently generated better results, sometimes much better results, then any other. What I found was that the Russell 2000 index (RUT) did better in my myriad of testing then any other index, including SPX, OEX, QQQQ, SPY and DIA.
Naturally, I Goggled this phenomenon and found a number of similar observations, best summed up here:
The Russell 2000, while not as popular as the S&P 500 or the Nasdaq, is actually much easier to trade. The broadness of the Russell’s index causes it to trend better than the Nasdaq and the S&P. The breadth of the 2000-stock-index tends to filter out the noise in the market, which makes it a more efficient market to trade. The brokerage houses tend to tout the S&P and Nasdaq markets because they are best know to the public. The Russell 2000, however, is utilized a great deal by institutional players because it trends so well.
And then this:
However, there is another market also catching the eye of many day traders — E-mini Russell futures. A quick glance at the top trading systems we ranked across seven different statistical measures at the end of 2004 showed something extraordinary — several E-mini Russell trading systems occupying spots at the top of the list.
So let’s take a look at the RUT, which coincidentally is the base index for four of the highest leveraged ETF’s: TNA, TZA, BGU and BGZ.
Above is our big picture Weekly chart of the Russell 2000 index. A week ago it flipped from LONG to SHORT for the first time since early March.
Noteworthy is the BUY level, at 529.12, just about 10 points above Friday’s close. Remember, on this Weekly chart, the index has to close above 529.12 next Friday to flip back to LONG.
Below is the Daily RUT chart:
Note here how the False Bar Stochastic is overbought and now in position for a reversal down. This can be quick, as soon as next week, or it can drag out for several more weeks.
Now let’s take a look at the first of our intraday trading charts, the 120-minute, or two-hour chart that is useful for swing or position trading:
The above chart covers the first two weeks of trading in July. Noteworthy here is how well this time frame stayed LONG with a trending RUT over the past week. The Blue Wave Precision CCI basically confirmed two trades, a SHORT followed by a LONG.
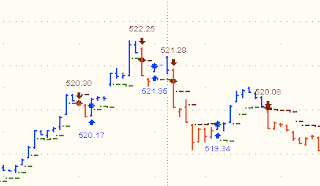
The chart above is the 5-minute RUT spanning the last two days of trading. What I see here is an excellent trading system with the only rough period at the subtle change of trend between the end of trading Thursday and early trading on Friday.
Here is a close up of what I am talking about:
Based on the past two days of trading we can see a system that generates a series of winning trades, with only a small time frame between trends that results in choppy trading. Here is a table of all trades taken Thursday and Friday with hypothetical gains, both with the unleveraged RUT and then with one of the Triple-Beta ETF’s:
Under the assumption these prices were available and that the Triple Beta ETF’s performed intraday as they are structured, two days worth of trading like this hypothetically generated a return of 9.73%. There are usually about 20 trading days in a month, so that there are 10, 2-day periods a month. That generates a hypothetical return of 90.73% a month.
Too good to be true? OK, let’s reduce gains by 90% just for the sake of skepticism. Now the return is a measly 9.73% per month. Hardly worth getting up out of bed, eh?
Sometimes I simply stand back and take a broad view of my models, what works and what doesn’t. This morning was one of those times, not looking for anything in particular, just browsing over test results, comparing them to my real time trading results, looking for any obvious red flags or other patterns, always seeking better trades, better returns and to some extent, less complexity and less work.
Today’s surprise was the RUT, how well it trades with Blue Wave and how much better RUT trends, even on the shortest time frames I trade.


