SPY Bearish Candles at the Highs
Courtesy of Corey at Afraid to Trade
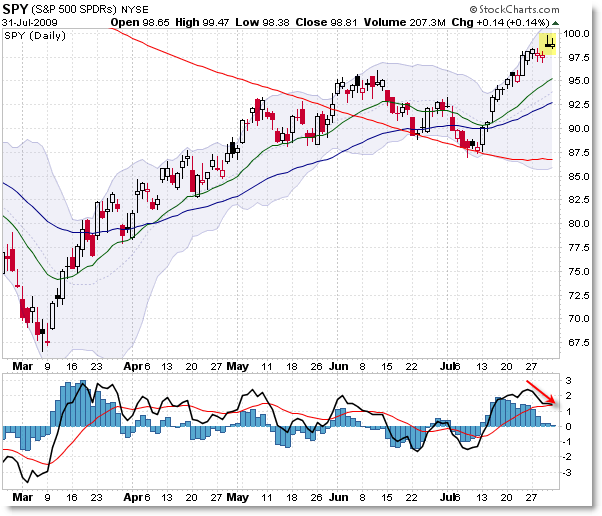
I wanted to show a quick update of the current SPY (which is similar to the DIA and QQQQ) ETF chart to note two ominous bearish candles at the recent highs of $100.00. Let’s take a look.

This chart shows the entire run-up from the early March 2009 lows to the current highs a few pennies shy of $100 (1,000 on the S&P 500 Index).
As price challenges this ‘magnet trade’ target, we see that the last two trading sessions have formed upside down doji candles, or more technically, shooting star patterns. The telling sign is the long upper shadows which indicate price rejection of the highs.
The 3/10 Momentum Oscillator is also slightly rolling over, indicating perhaps that this swing up has ‘run its course’ and that a corrective move down is now forming – under normal circumstances.
My suggestion for the weekend is to take a moment to look at leading stocks (like AAPL, GOOG, XOM, WMT, INTC, etc) to see what type of candle formations have set-up at the recent highs in these stocks.
For example, in Google (GOOG), a bearish engulfing candle formed on Friday’s trading after Thursday’s doji – not a good sign.
Again, no guarantees of a reversal, but these bearish candles at the highs are glaring non-confirmations and could serve as early warning signals that a turn is around the corner – at the minimum, it’s not the type of ‘candle action’ bulls want to see at the highs.
Corey Rosenbloom, CMT
Afraid to Trade.com


