
Correlation: In statistics, it’s the degree to which two or more variables show a tendency to move relative to each other. In finance, it’s the tendency of two or more securities, sectors or asset classes to move together.
Correlation values range from -1 to +1. If one stock moves in perfect lockstep with another, the correlation is going to be +1. If they move exactly opposite one another, the correlation is going to be -1.
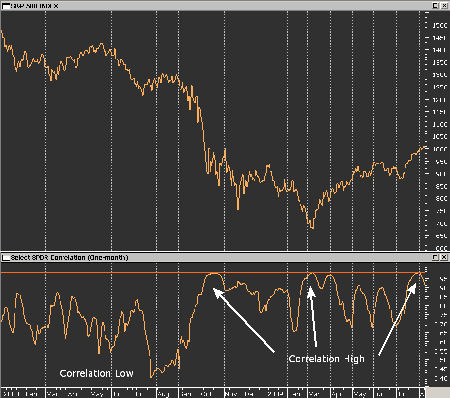
Needless to say, a perfect correlation of + or -1 is nearly impossible. But recently, we’ve seen a few examples where correlations have climbed to unusually high levels. The correlations I’m speaking of are the various Sector SPDRs and the S&P 500 SPDR.
Continued at Don Fishback’s Market Update


