
How Low Can We Go?
 Courtesy of Charles Hugh Smith, Of Two Minds
The six-month long global stock market is losing steam, which begs the question: how low can we go?
Is this a new Bull market or just another typical Bear Market rally? Let’s look at two charts for clues.
First, read the HUGE GIANT BIG FAT DISCLAIMER below: these are the free rantings of an amateur ignoramous, etc. etc.
Before we glance at the charts, let’s ask: has anything really been fixed in the global financial markets and economy, or have all the problems just been papered over with trillions in central bank bail-outs, loan guarantees, stimulus and bogus accounting/statistical lies?
The VIX is one measure of volatility or what is sometimes called "the fear index." When confidence reigns supreme (with an emphasis on the "con") then the market players see no reason to bid up options to protect themselves from potential drops into the abyss. So when confidence is high then the VIX is low and stable:
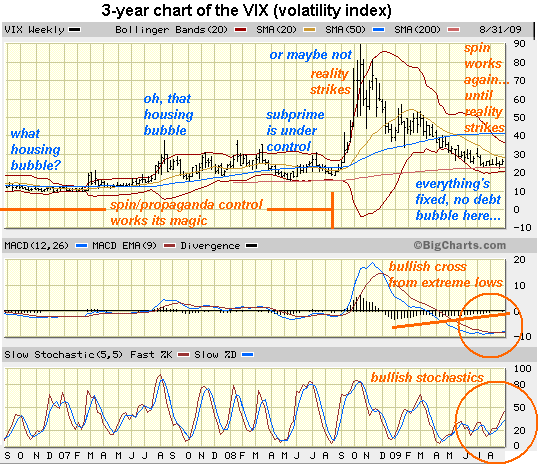
When the wheels finally fell off the MSM/central bank fantasy that "subprime is under control" then fear sprouted wings and the VIX soared.
Judging by the VIX’s return to the low-to-mid 20s, then confidence has returned in full force and the fears of a global meltdown have vanished.
Nice, but what if nothing has really been fixed? What if market participants sniff out that everything’s just been swept under the rug? What if the $7 trillion commercial real estate market in the U.S. is about to slip into the abyss of domino defaults?
The Shanghai market’s sudden 10% drop in only two days suggests not all global players are convinced.
The MACD on the VIX is crossing at a very low level, suggesting a lengthy period of rising volatility could be upon us. The stochastic has been rising for awhile now, having made a bullish cross last month.
In sum: the VIX seems to be warning us low volatility may be giving way to higher volatility.
Here’s a chart of the Dow Jones Industrial Average:
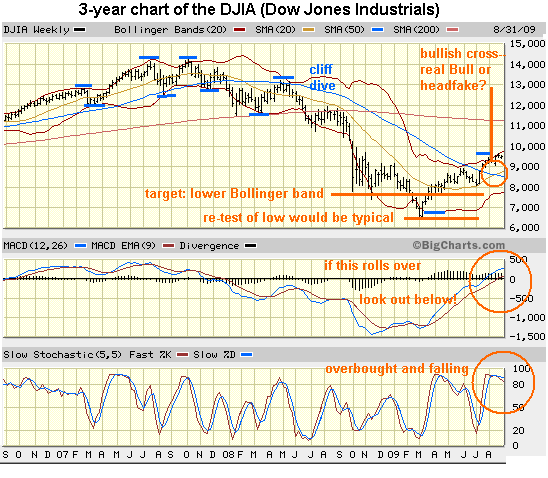
One fairly predictable pattern in any market chart is that price tends to oscillate between the upper and lower Bollinger band. I’ve marked this trait with small blue lines.
When markets are trending strongly, they can ride the Bollinger bands up or down. But if this is once again a "normal" market, as the VIX suggests, then it would be entirely normal for price to drift down to touch the lower Bollinger–around 7,800 or so, with the caveat that the bands expand in volatile markets and thus if they widen then the lower band drops.
In other words, if volatility increases, then the bands widen and the target drops accordingly.
Many observers are recalling that stocks tend to re-test their lows after severe drops, something which forms a "double bottom." The psychology is supposedly something like this: participants can’t really be sure there won’t be a new low until the market dips down and bounces off its last low.
If this holds true, then it would entirely normal for the DJI to drop back to the 6,500 area. From its high last week at 9,600, that’s about a 3,000 point decline.
 Standard issue financial pundits (SIFPs) are mewing calm words about a 10% decline of "profit taking."
Better keep a chart of the VIX handy just as a real-world test of those placid reassurances. If the VIX keeps rising, then Wiley Coyote may find he’s run off the cliff into thin air.
I’ve added a number of books to my comprehensive list: Books and Films
If you want more troubling/revolutionary/annoying analysis, please read Free eBook now available: HTML version: Survival+: Structuring Prosperity for Yourself and the Nation (PDF version (111 pages): Survival+)


