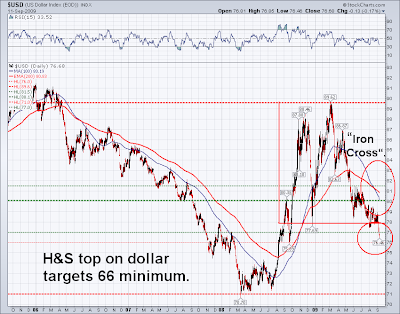
H&S Top and "Iron Cross" on Weekly Dollar Chart Targets 66
Courtesy of Jesse’s Café Américain
The weekly chart on the US Dollar Index has rather awful technicals, as it has dropped to a recent low, and set the ‘iron cross’ in the moving averages that is generally the hallmark of a sustained decline.
There is a massive Head & Shoulders formation that *should* preclude a rally over 81 if it is working, limiting any gains to a further ‘right shoulder.’
The ultimate objective of this formation remains 66.
It is difficult to square this with a technical outlook that includes a major decline in the US equity indices, since the pairs have been running inversely, that is, dollar down, and stocks up.
Anything is possible, especially when the governments are actively and aggressively ‘tinkering’ with the markets. It is possible that the Fed monetizes sufficiently to reinflate an equity bubble, essentially whoring out the Dollar and the real economy for the sake of the financial or FIRE sector.


