
MARKET IN REVIEW
BUYING STOCKS AT SAFE, ALTERNATIVE ENTRY POINTS
Courtesy of David Grandey at All About Trends
The big questions on a lot of folks minds are: "Was That It? and Did We Just Top?" In order to answer those questions let’s look at what the daily index charts off the March 2009 lows have to say about that.
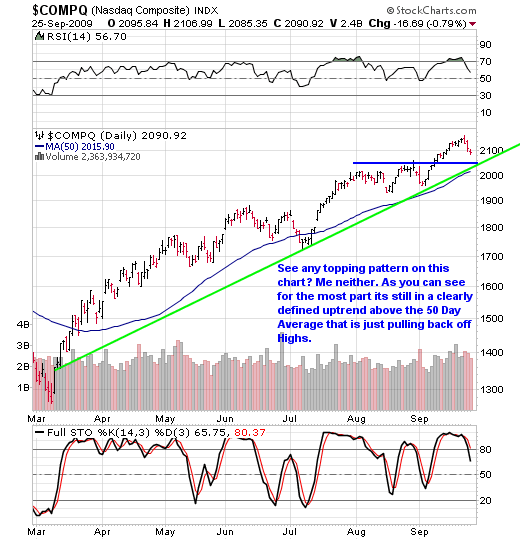
The Nasdaq, Dow and S&P indexes have uptrends that are still intact. The green lines, the blue line and the 50 day moving average are your guides. As of this moment, we see NO TOP on the market.
HOWEVER, IF we see a quick run sometime next week to a retest of the highs and then a pullback off of that retest, those developments will create a double top and we’ll be more apt to call a short term top at that time.
Why does the presence of a Double Top cause us to be more likely to change our position on the market? Because the Double Top is one of the most common early warning alert patterns warning of a change in trend.
=================================================
HOW TO BUY STOCKS AT SAFE, ALTERNATIVE ENTRY POINTS
So now that the indexes are pulling back, but remain in a clearly defined uptrend above their uptrend lines and 50-day moving averages, we want to focus on stocks that are in the same position and have simply pulled back off of their highs to those support levels. This is called trading in tandem with the market.
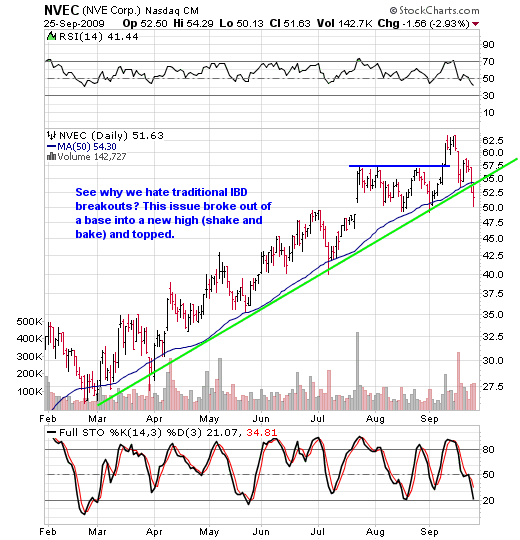
Now there are two ways to buy stocks. The first way is to find a stock that has formed a base and buy it when it breaks into new highs above the base. This is called buying a traditional breakout. Here’s a look at some recent breakouts:
.png)
As you can see with each of these, after breaking out, they quickly turned tail to retest what was resistance (now should be support), and each of them actually closed under support or back in the base. If you had bought them with a stop loss, chances are after a few feel-good days, you were stopped out.
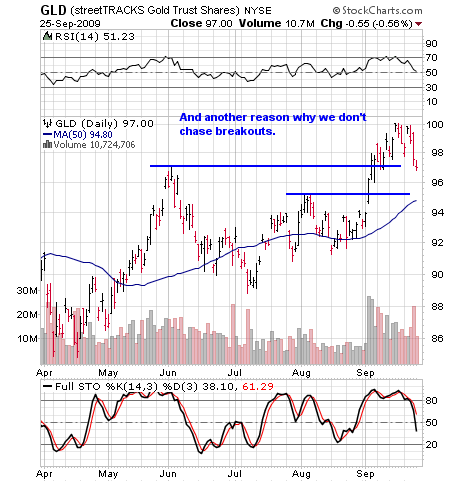
Now let’s look at the second way:
.png)
As you can see here, this issue broke out. But most breakouts consolidate their gains and retest the area that was once resistance. So rather than chase the stock, we patiently wait for it to come to us.
In this case, the pink line represents the stock’s pullback off of its highs back to what was once resistance, that now should be support. Our buy point is a break above the pink line.
A classic buy support and sell resistance trade. That’s a lot better than chasing a stock only to get stopped out as the stock retests support and then takes off without you.
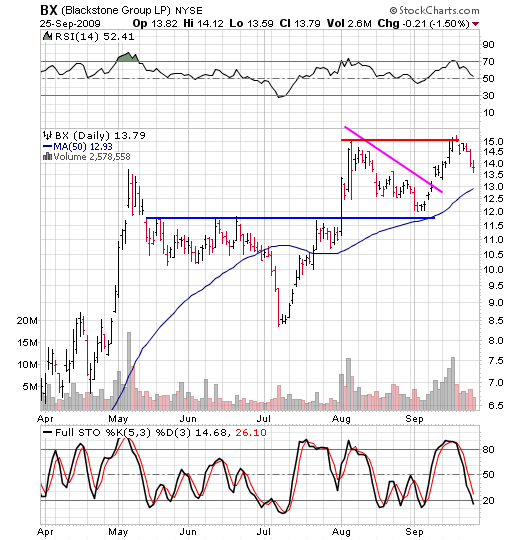
The chart below offers another textbook example of a stock that broke out, then pulled back to test resistance before launching its way to new highs.
.png)
So what does that mean for us today?
Well, since the markets have pulled back to near short-term support, now is the time to be prepared to take advantage of these opportunities — opportunities to buy stocks in confirmed uptrends at a risk-adverse place.
For more information, sign up for our free newsletter at www.allabouttrends.net.
*****
Note: All About Trends focuses on using solid technical analysis to buy and sell-short stocks at earlier, alternative entry points. Their email newsletter is distributed twice a week. When a stock on their watch list triggers a new trade, they issue an email alert, so you can follow along with their trades. They also send out email alerts when they are locking in profits or exercising their stop loss. Click here to view their excellent performance history. You can sign up for a free newsletter, and if you choose to subscribe to their service, they are offering a discount to PSW members, just $10 month for the first two months (a 67% discount!). Click here to get started. – Ilene


