
TRADE IN TANDEM WITH THE MARKET
By David Grandey
As you can see in the 15-minute time frequency charts of the indexes, there are two things going on.
1. We are locked in a downtrending channel as defined by the blue lines. If we are going to continue that path then channel support is the lower blue lines.
.png)
.png)
With all the after charts what we’ve laid out here are POTENTIAL wave counts according to an Elliott Wave Script from here on out IF IF IF this is going to be a 5-waves affair down (abcde). IF it’s a 3-waves affair down (abc),then we are done going down in the short term. However we can’t say that till we see what bounce mode brings next week and what the action looks like at the dark blue down channel resistance lines.
So this is your short-term forecast, watch for it.
.png)
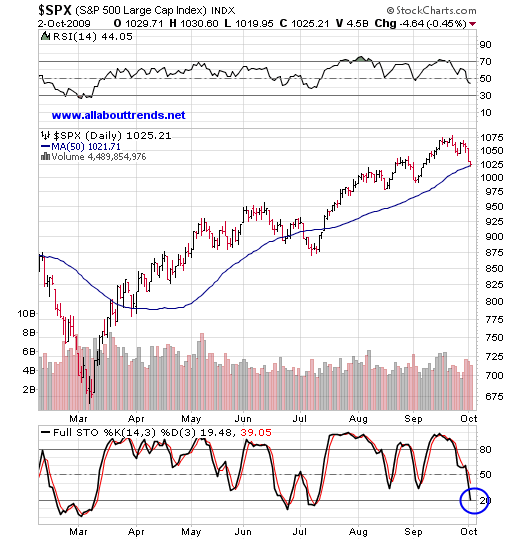
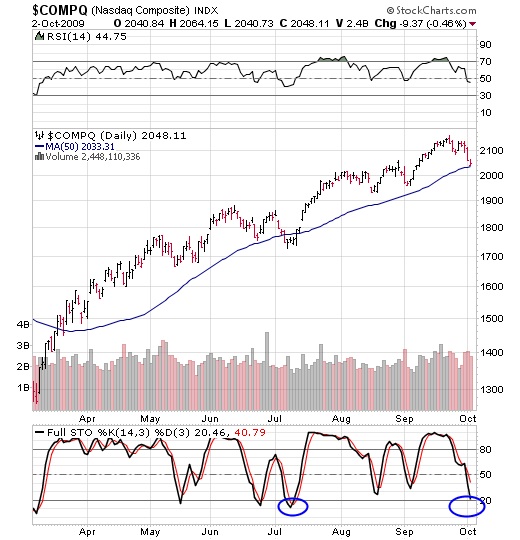
As of this moment in time you can see each index hitting its 50-day average with the Full Stohs oversold. So from a daily perspective this is a logical level for the markets to stage some sort of bounce. The super short term charts of the indexes at the begining of this report are where you want to key in on. They will tell you when a bounce occurs and just how strong that bounce may be.
The signature pattern we look for on the long side is the Pullback Off Highs pattern as you can see here:
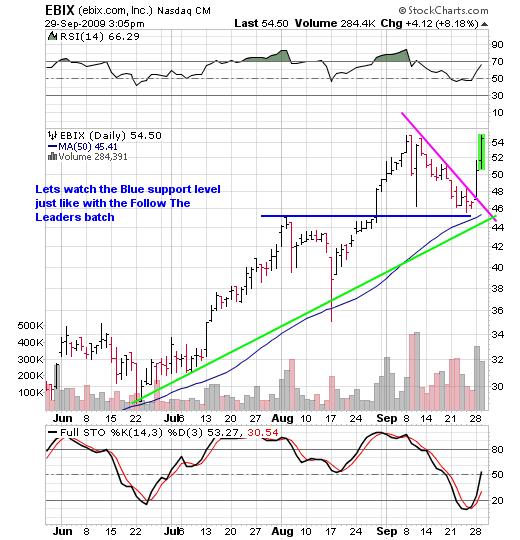
When a stock is moving higher, it doesn’t go straight up. Instead, it rises, then consolidates its gains before resuming its move higher. These mini-downtrends are where it pulls back off of its highs in an orderly manner — often to an area of key support such as its upward trendline and/or 50-day moving average.
We draw a line connecting the lines of the mini-downtrend. A break above the pink line triggers a trade on the long side. For that reason, EBIX was an idea long side set-up.
EBIX triggered a trade Monday by breaking above the pink line. By the end of the day Tuesday, EBIX was knocking on the door of resistance at its old highs — an 18% gain in two-days! This is a classic buy support and sell at resistance trade.
And in the world of swing trading, 18% in two-days is huge! Just think about it. Let’s say you have a portfolio of $50,000. And you invest in 100 shares of EBIX at $47.10. After selling it at $54.64, you’ve made a two-day profit of $754.
These are the patterns we’ll be looking for in the near short-term.
To learn more, sign up for our free newsletter at www.allabouttrends.net.


