
A Bull, a Bear and a Pig Walk Into a Bar… Another Massive Chart Dump
Courtesy of Binve at Market Thoughts and Analysis
Okay, time for another one of binve’s Massive Chart Dumps! It is like a TA colonic, and will make you feel right as rain. But I certainly don’t mean these charts belong in the toilet!. …. okay, enough scatological humor for one post.
My last Chart Dump was this one: Another Massive Chart Dump / P2 Analysis Wrap-Up that I wrote on Sept 26. Let’s take a look at a few excerpts to see how I did:
"…So is Primary Wave 2 [the current move up in stocks] done?
I just don’t think it is done. But I do think it is very close to being done. There is a count option, that is possible, that shows it could be done (the spike to 1080 on the SPX last week), but I don’t think it is. I think there is one more wave up left in it that will make a higher high (up to about 1100) somewhere in the beginning of October. …"
Hmmmm…. Not bad. We did get a move to 1101, however I was calling it a bit early. A number of indices and company charts were showing negative divergences and it seemed like one more move up would seal the deal on P2 for nearly all of them.
Is Primary 2 done?
In short, I’d say yes. I think there are enough divergences, enough waning momentum, with bullishness peaked to an extreme.
But there are two ways to play this: aggressively or conservatively. I am the aggressive type. And so while I have positioned my portfolio accordingly, there is certainly a much safer way to play this. I discussed this very scenario a couple of weeks ago here: Whew! One Crazy week! However I Think Next Week Will Make Last Week Look Like a Walk in the Park 🙂 – Oct 18
The most obvious question is: Did we reach the top (end of P2) last week, or if we have one small wave up next week, will that be the end of P2?
The best answer anyone can give you is: maybe…
[A confirmation move:] "a clear impulsive *MINUTE DEGREE* wave down (5 full Minuette degree waves), followed by a 3 wave Minute degree correction with a lower high on all the major indices (SPX, INDU, RUT, COMPQ, and NDX), and then followed by another Minute degree wave down…"
I am heavily short right now. But if you are more conservative, wait for a confirmation move.
The final wave of P2 should have:
– Low volume
– Low volatility
– Low breadth and decreasing breadth as it moves up
– Daily divergences of technical indicators (MACD, RSI, and TRIN more importantly)
– Lots of extension with little pullback and possibly a 5th wave extension for a blow-off, not because of a bullish move but because of little bearish resistance.
The last wave up to 1101 had absolutely all of these qualities, noted in these posts:
– Man SPX, Your Brea(d)th Stinks!
– SPX says "Pass Me the Binaca!"
– Whew! One Crazy week! However I Think Next Week Will Make Last Week Look Like a Walk in the Park 🙂
Many of us EW bloggers are charting this rally to find the top of Primary wave 2 up, and start of Primary wave 3 down. As this rally (P2) extends, it is suckering in the small retail LTBH investors who will buy at the top and become the bagholders.
I am very skeptical of claims from economists that "we have turned the corner, recession is over!" (See binve’s Long Term View.) I am very skeptical of upgrades from Wall Street analysts and brokers (see Sometimes the Truest Points are Made Through Humor)
Either Primary 2 is done or we have another rally coming that could make a modest nominal higher high. However, either way, I think the upside to be gained is trivial in comparison to the downside risk.
This rally looks tired. I believe the Primary trend has changed and we are now going to resume trading in the direction of the secular trend…. which is down How far down? For my take on that please read binve’s Long Term View
The Primary Wave 2 Checklist
There are several signals that help to let us know we are at the end of Primary Wave 2. There are some characteristics that Elliott (and then Frost and Prechter later) put forth that would describe some of the technical, fundamental and sentiment aspects of Wave 2. Here are some of those (modified to be bullish, as this Wave 2 is bullish):
From EWP: “Second Waves often retrace so much of Wave One that most of the losses endured are gained back by the time it ends. At this point investors are thoroughly convinced that the bull market is here to stay. Second waves typically end on very low volume and volatility.”
Additionally, bullishness sentiment returns, and is often as high as it was at the peak, despite the technical long term damage that was done by Wave 1.
Here is my P2 Checklist:
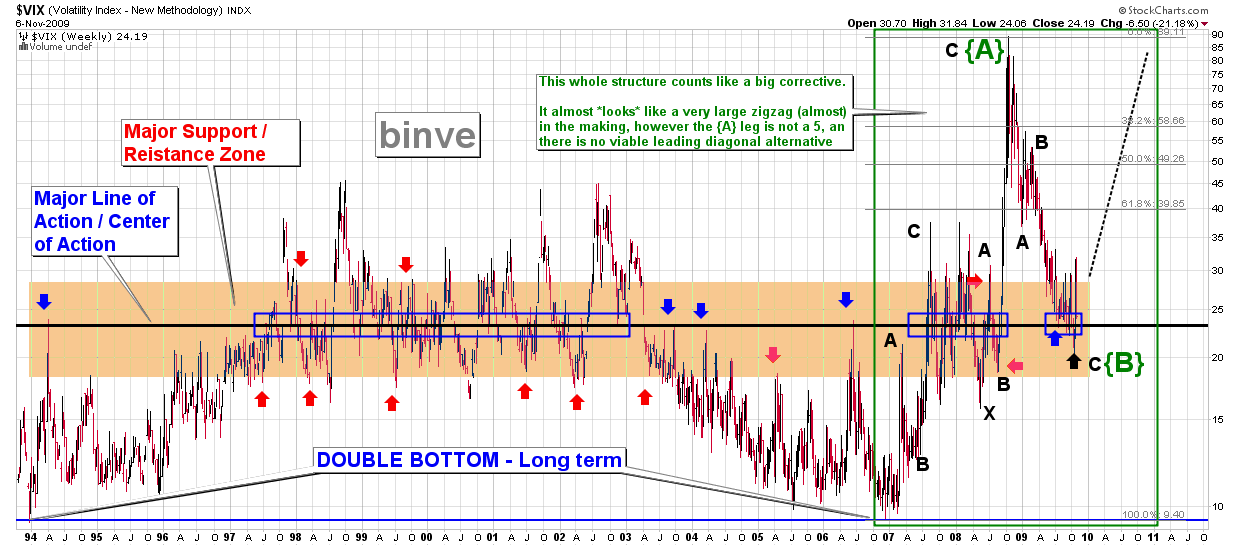
– X – VIX Low
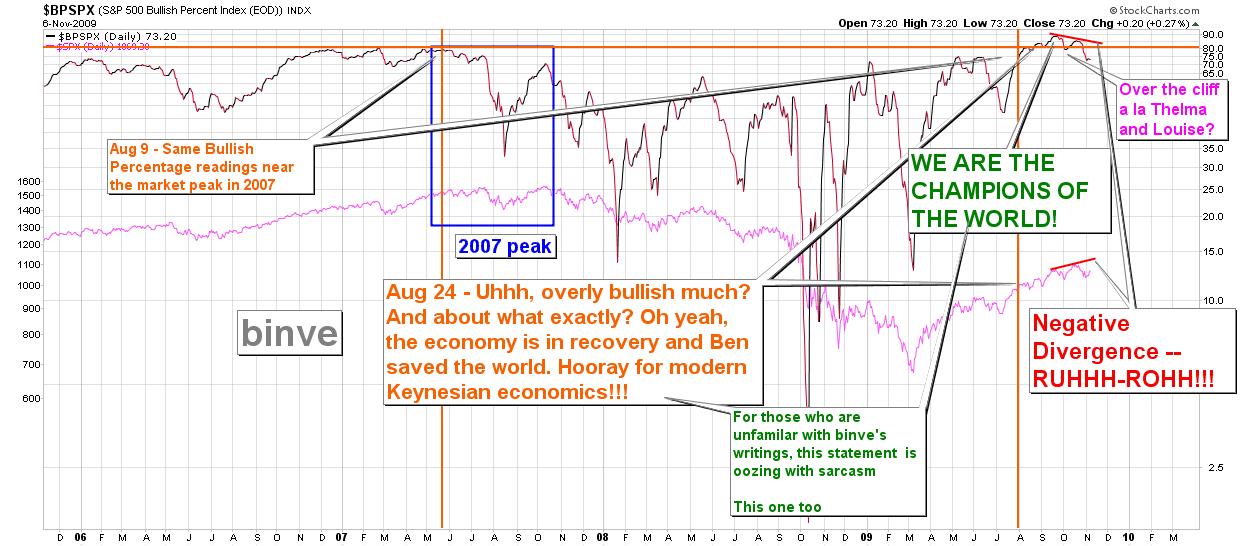
– X – BPSPX (and other bullish indicators) at higher highs than 2007 peak
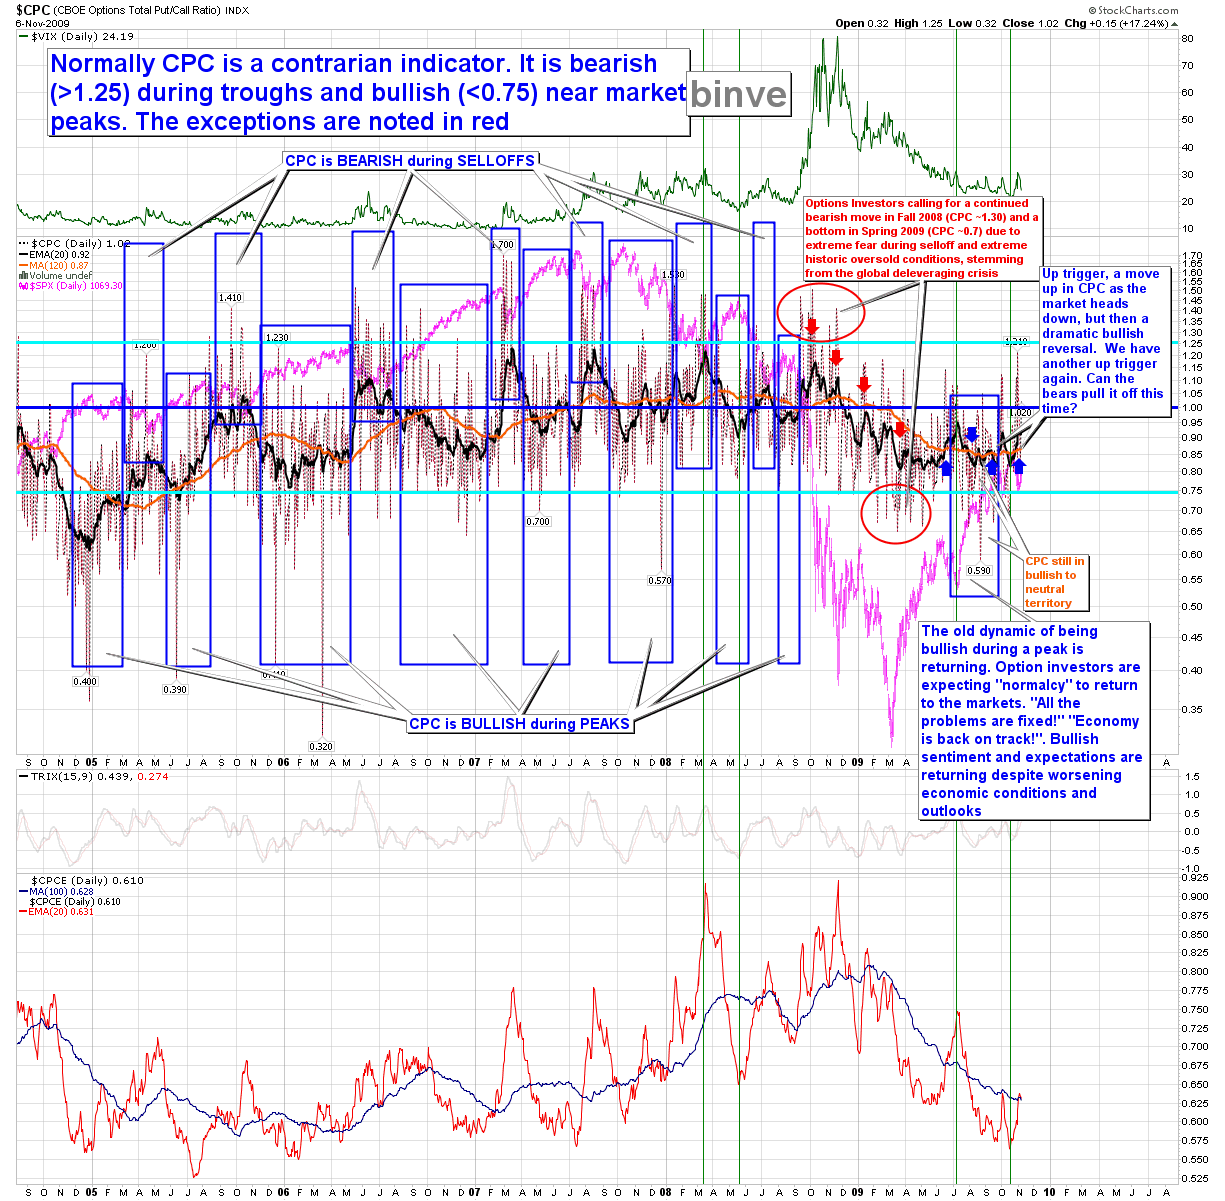
– X – CPC at uber-bullish levels
– X – Investor Sentiment above 80%
– X – Economists declaring "end of the recession"
– X – Analysts upgrading everything that can be traded (or rather unloaded)
– X – "Speculative Leader" indices showing weakness / bearish divergence
– X – Clear end count for P2
…. And I think all the pieces are now in place.
Who wants a snack? (thanks MissMalibu !!) 🙂

Let’s Start at the Beginning: SPX Long and Short Counts and Then a Few Other Major Indices
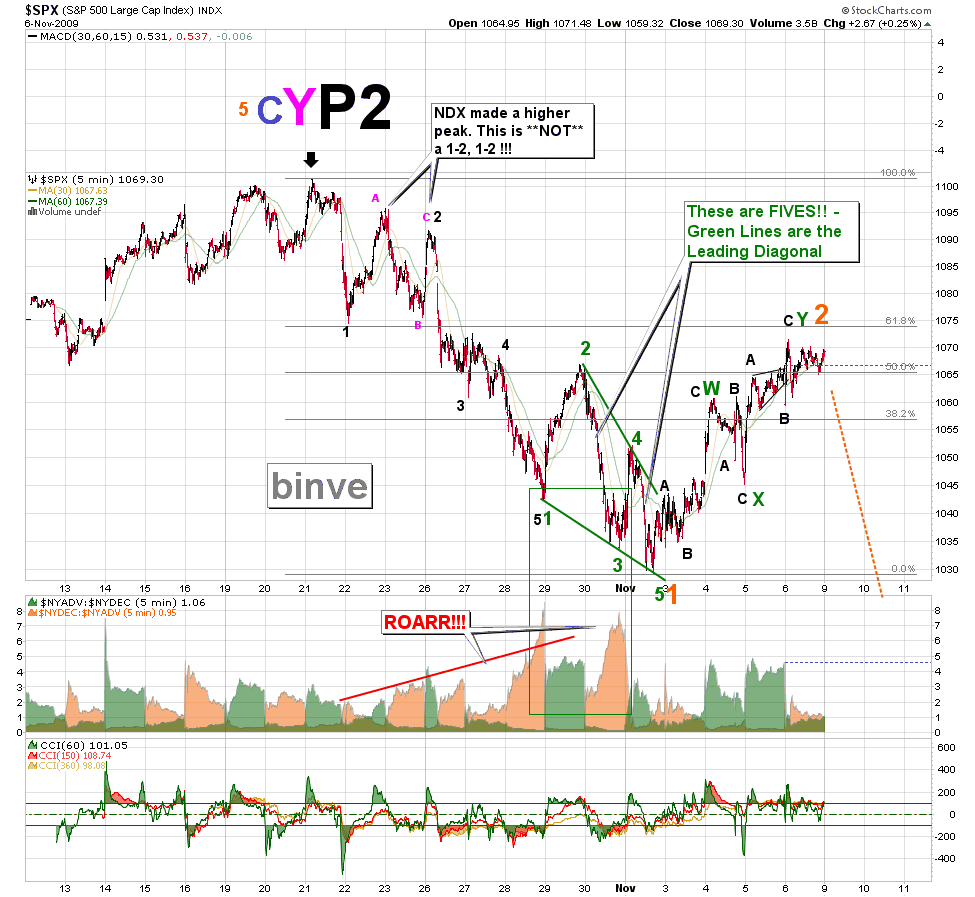
Let’s look at the SPX from the perspective of all of Primary Wave 2 and then zoom in [click on charts for larger views]:

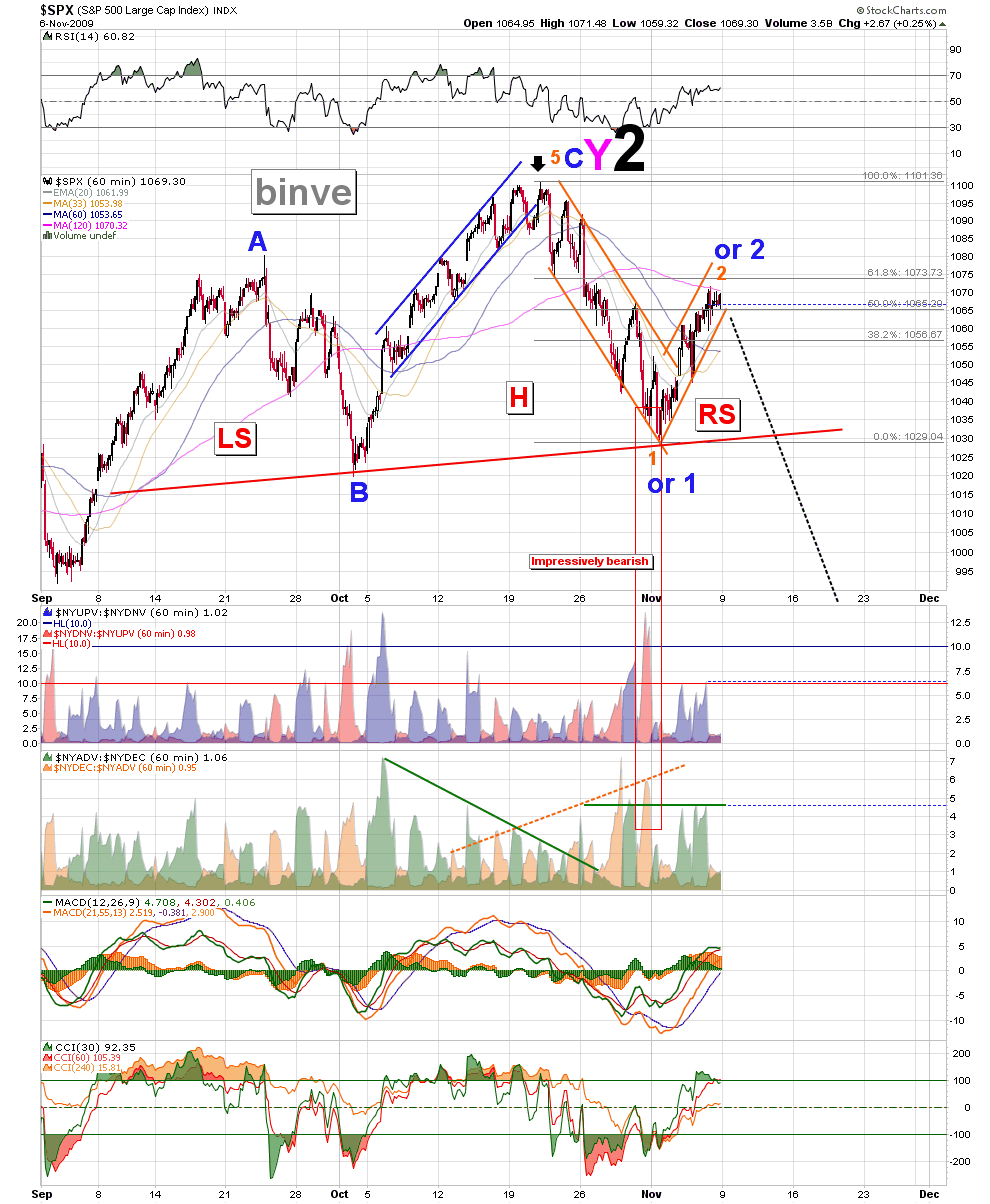

So this is the case I am making from an Elliott Wave perspective for the completion of Primary 2.
But let’s look at some more traditional indicators and see what those are saying on the daily and weekly charts
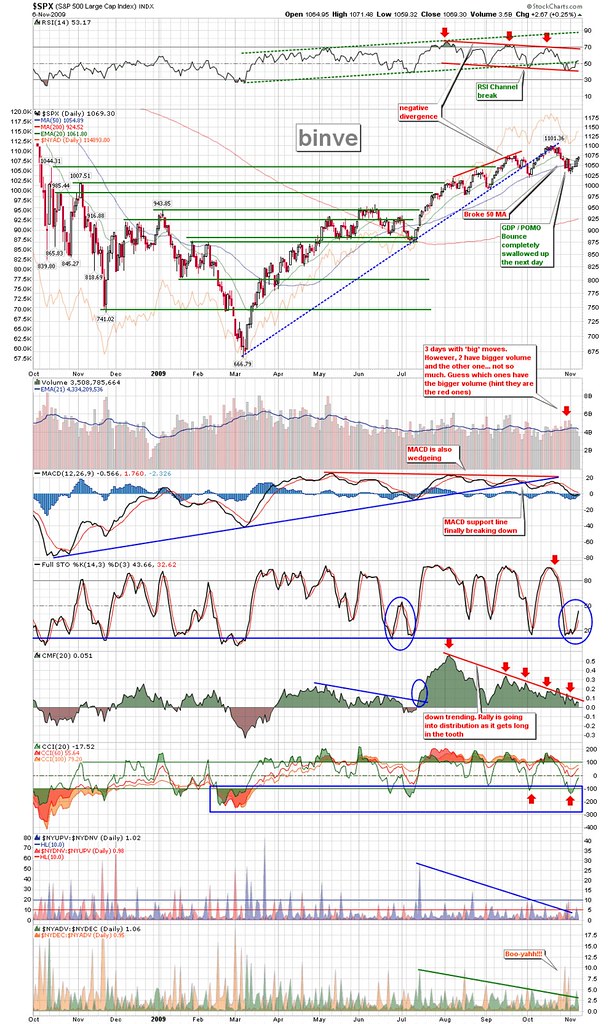
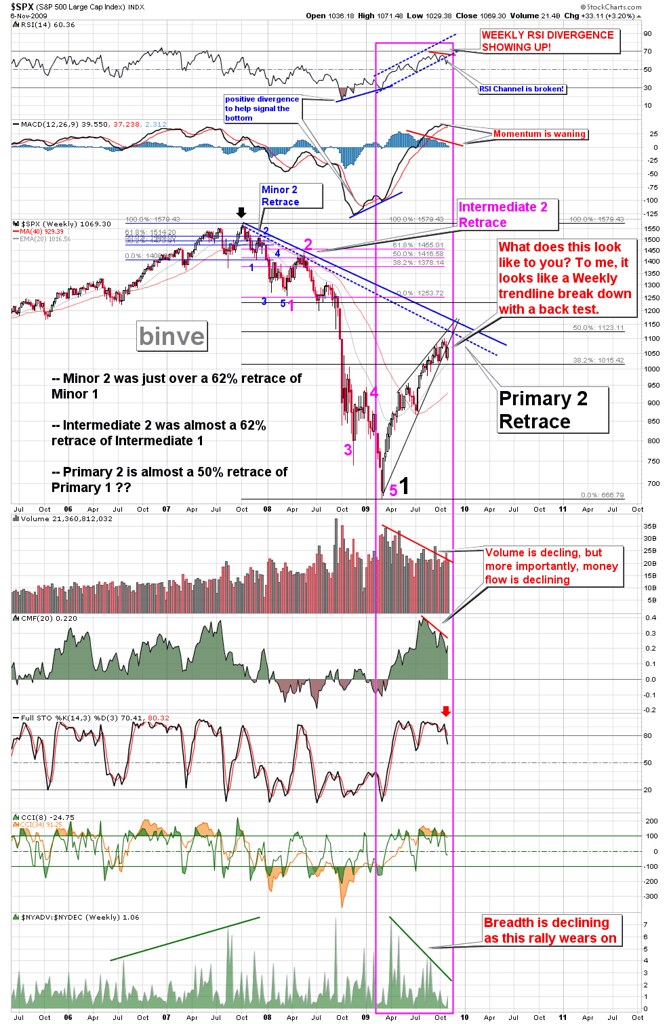
I see waning momentum, topping taking place in terms of the price action rolling over, the RSI giving some very bearish signals (divergence on both the Daily and WEEKLY charts as well as channel breaks of these indicators), and most importantly, this rally has gone into distribution all the way up. Like a candle in an enclosure that gets larger as it uses up all the oxygen, the price is increasing as people are selling into it.
Next let’s looks at how the 5 major US indices have fared over the past few months (SPX, INDU, NDX, COMPQ and RUT). Here are a few posts where I look at these relationships:
– Retraces
– RUT Broke the Oct 2 Low !!
– Reading you Five by Five
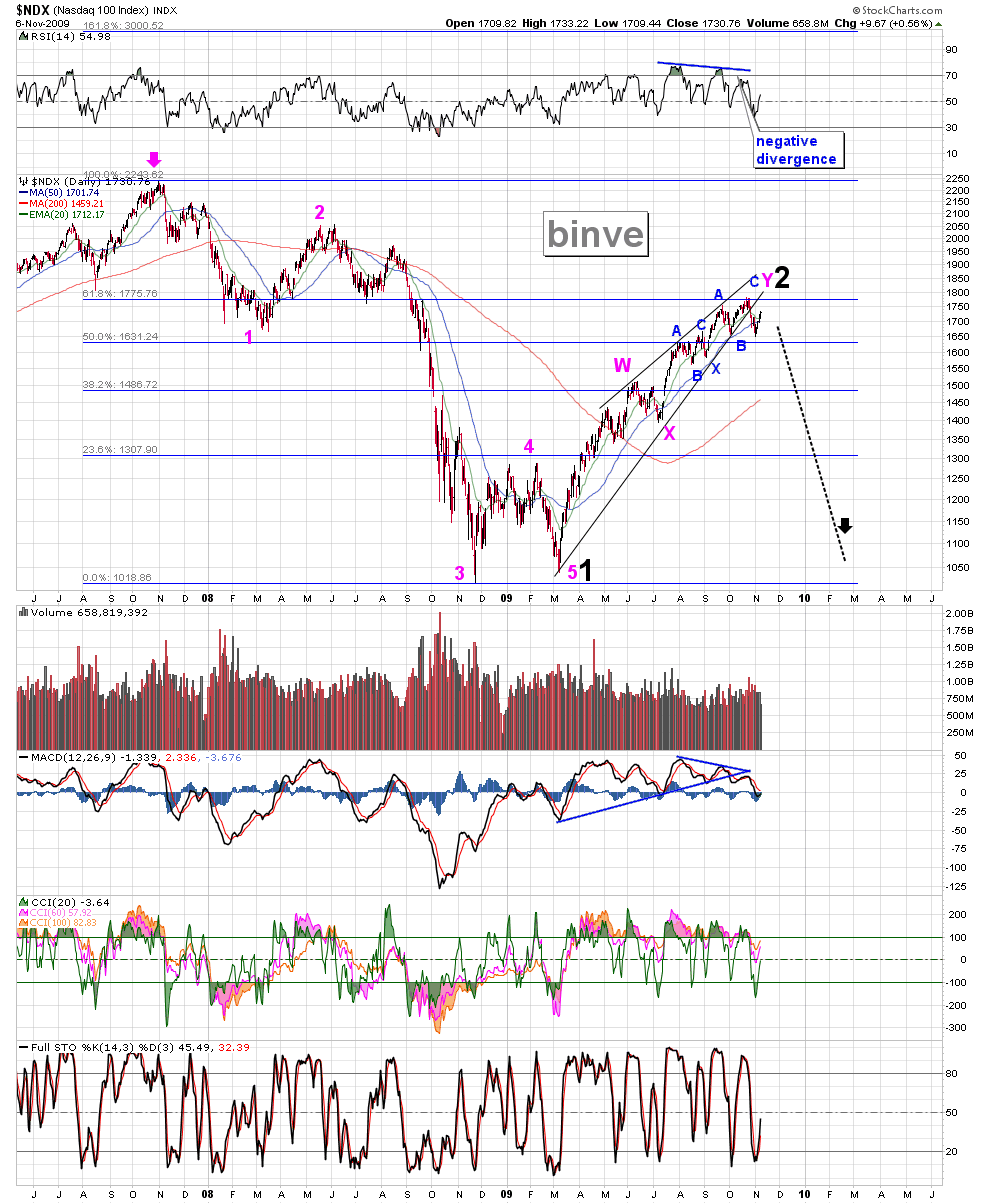
The biggest observation is that the Russell 2000, NASDAQ 100 and NASDAQ composite all broke below their Oct 2 lows!!. This is a very substantial development that portends a lot of weakness. I think all the indices have retraced the requisite amount in this up correction the past week to start heading down next week.
Retracements:
– INDU: 78%
– SPX: >50%
– NDX: 62%
– COMPQ: >50%
– RUT: >38% (and by far the most sold off index)


Sentiment
All sentiment indicators are still reading highly bullish – CHECK! Read the notes on the charts, absolutely ridiculous. But what is critical is that we saw some divergence in sentiment (between BPSPX and SPX). Also some of the sentiment surveys peaked at the end of September and showed slightly lower readings for the October peak. Perfect.
CPC
I wrote a recent post on the CPC here: If You’re Friends With P. Please check it out.
VIX
I have written several posts on the VIX. This is a critical chart to watch as it will be difficult to have a top in the market without a corresponding bottom in the VIX. I called the bottom in the VIX in this post: The Market Moves Vixenishly on Oct 23


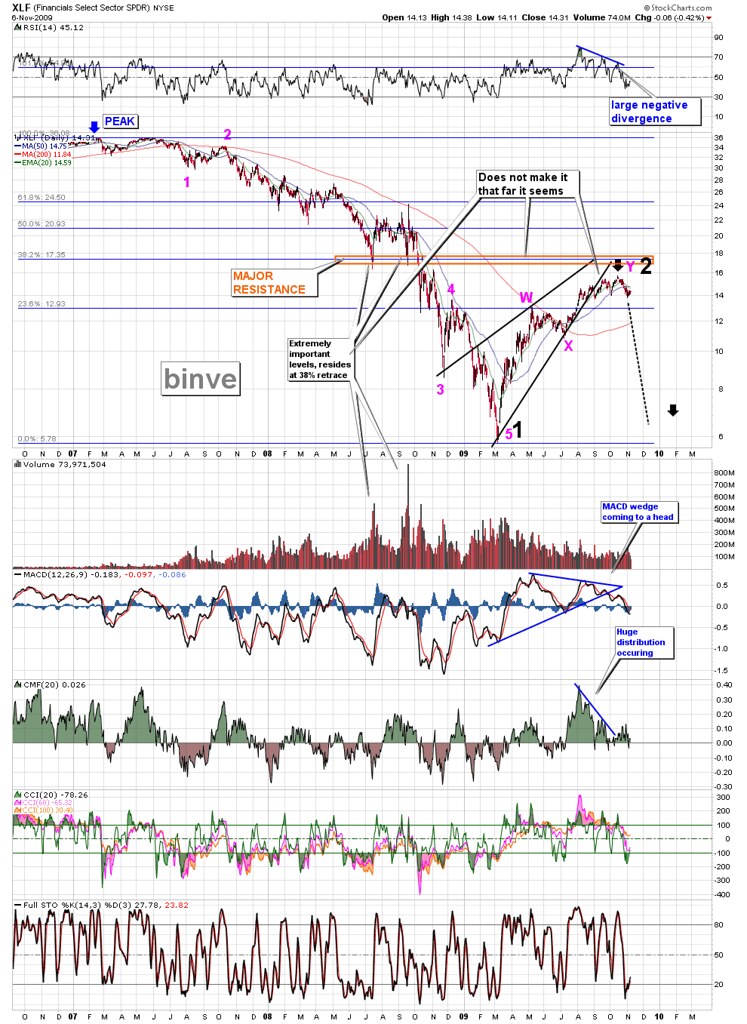
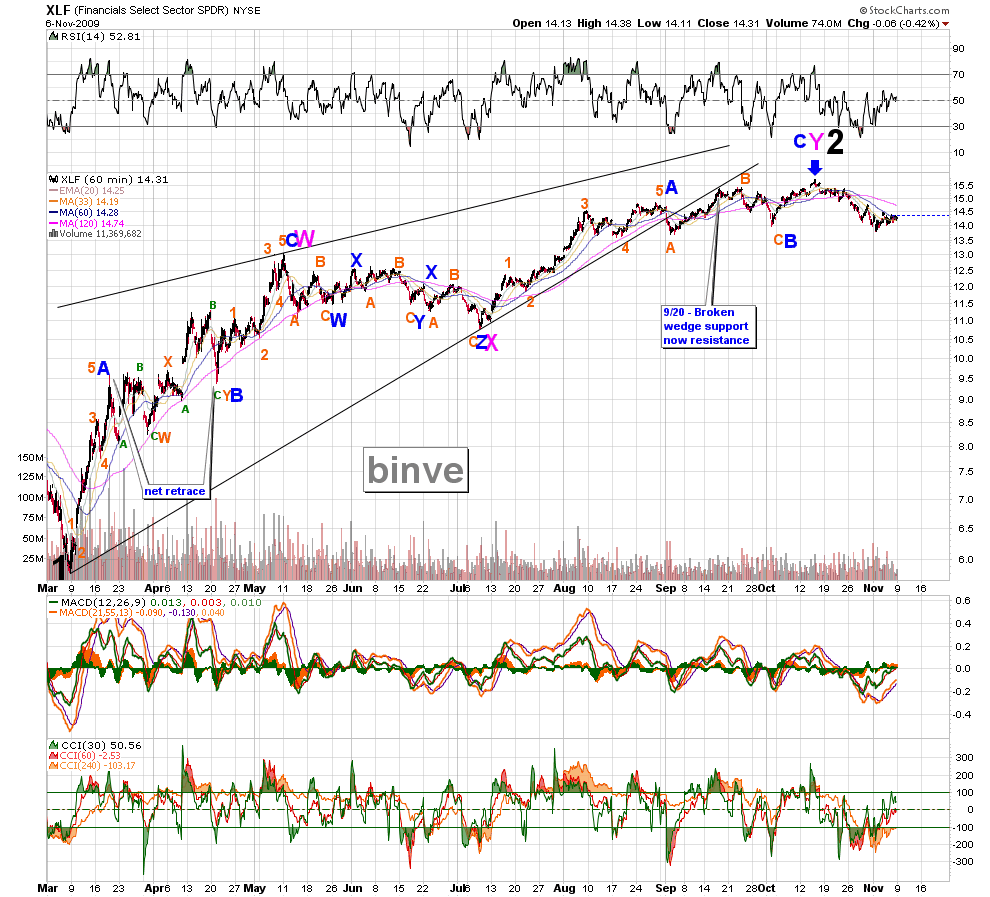
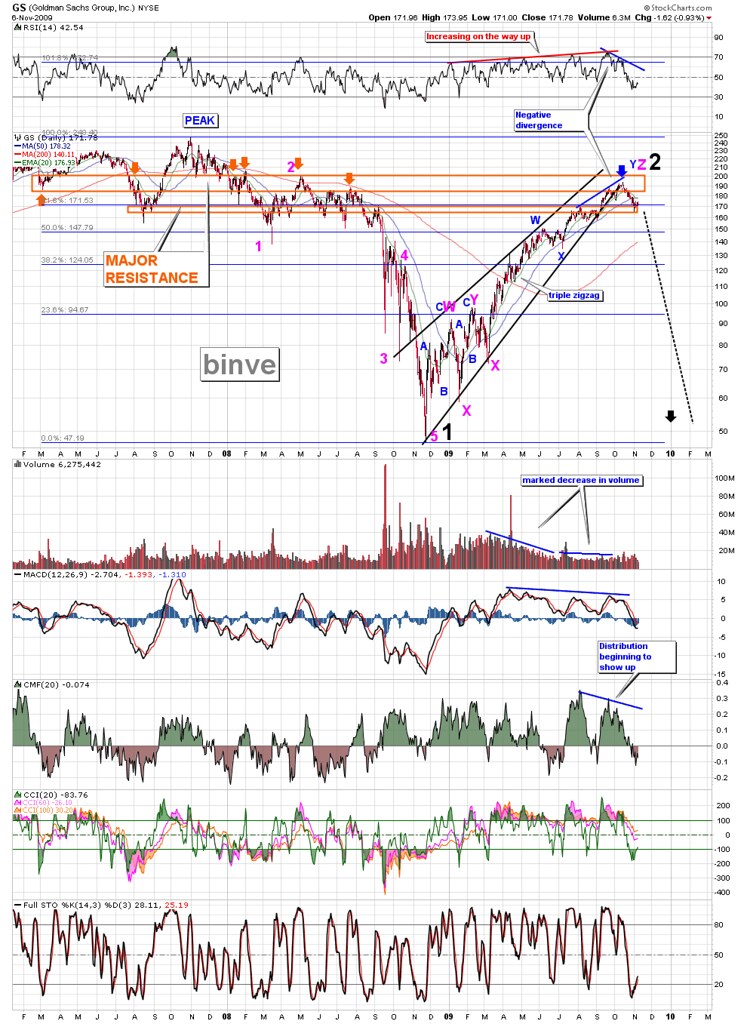
Financials
Next, let’s look at a major "canary in the coal mine" sector: Financials. There is still a lot of "un-bullish" developments occurring in financials right now.
The notes I wrote on the charts tell the story. One reason I called for one more wave up to 1100 back in Sept in the last Massive Chart Dump was because GS, the undoubted leader in financials, did not look complete. There was no divergence at all between the price and it indicators.
Well guess what, there is now!!. I think all of the financials (the big guys at any rate) now look done and most importantly, so do XLF and BKX.


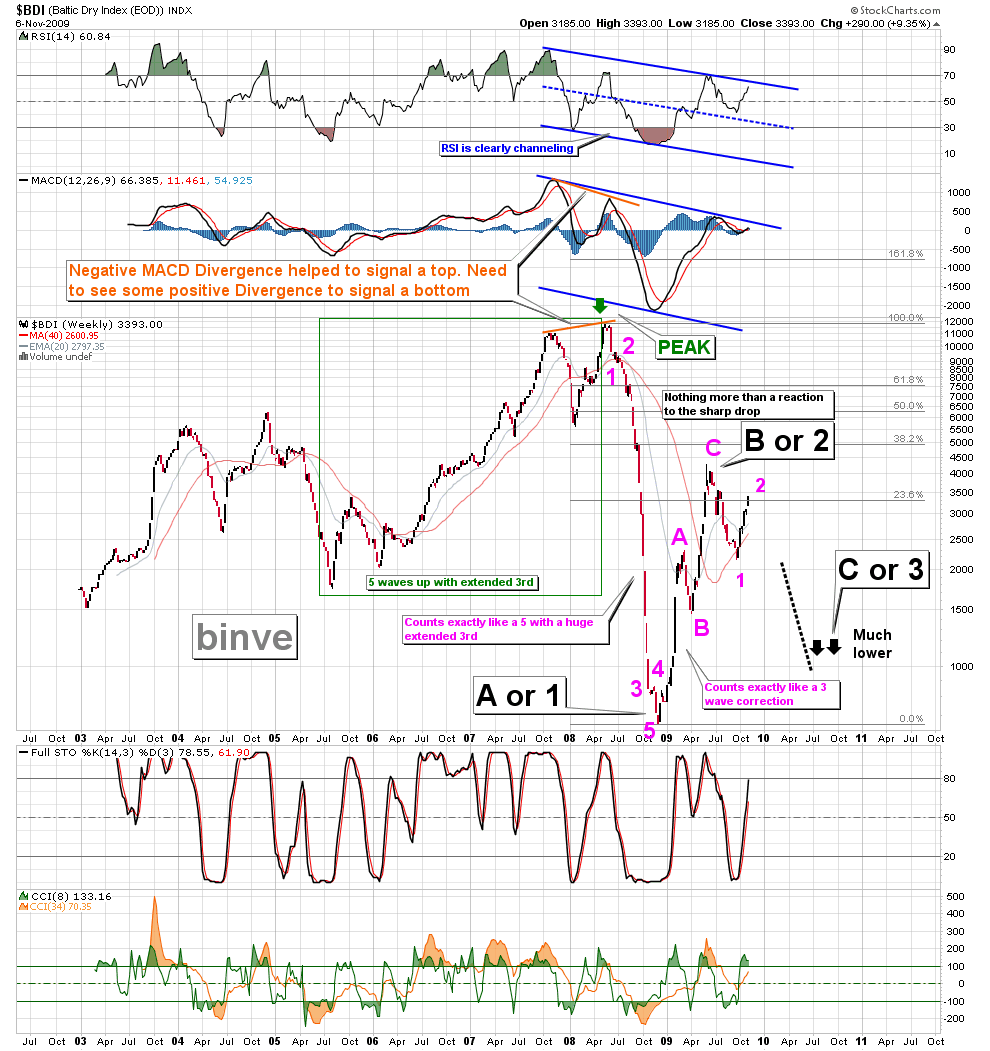
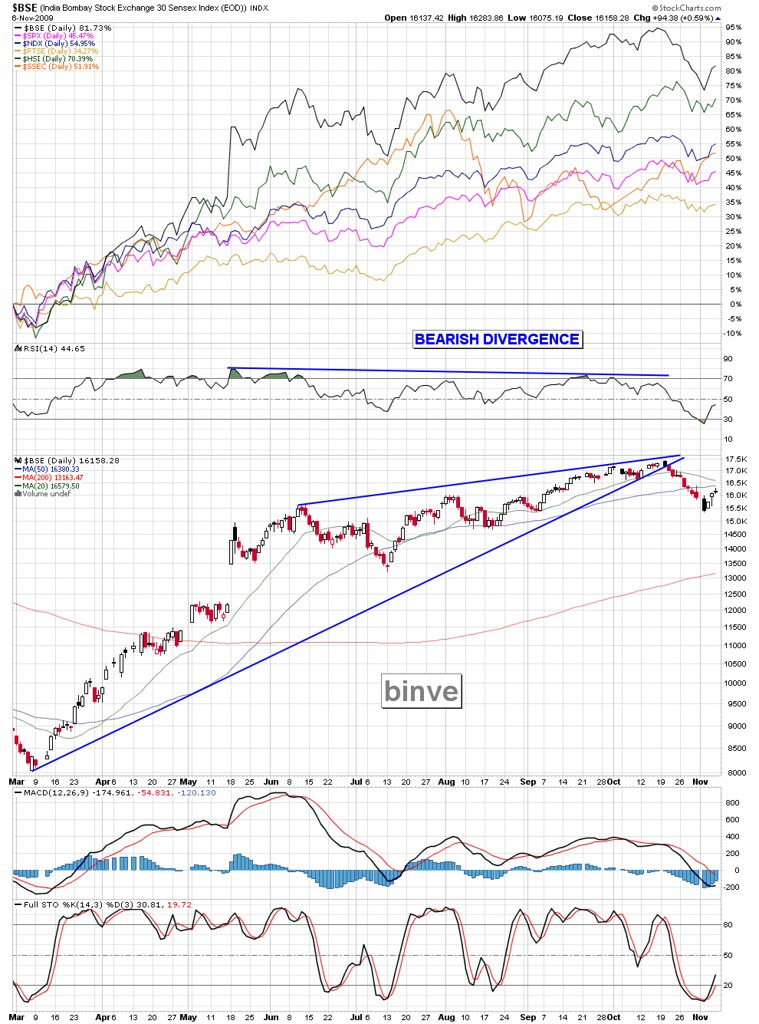
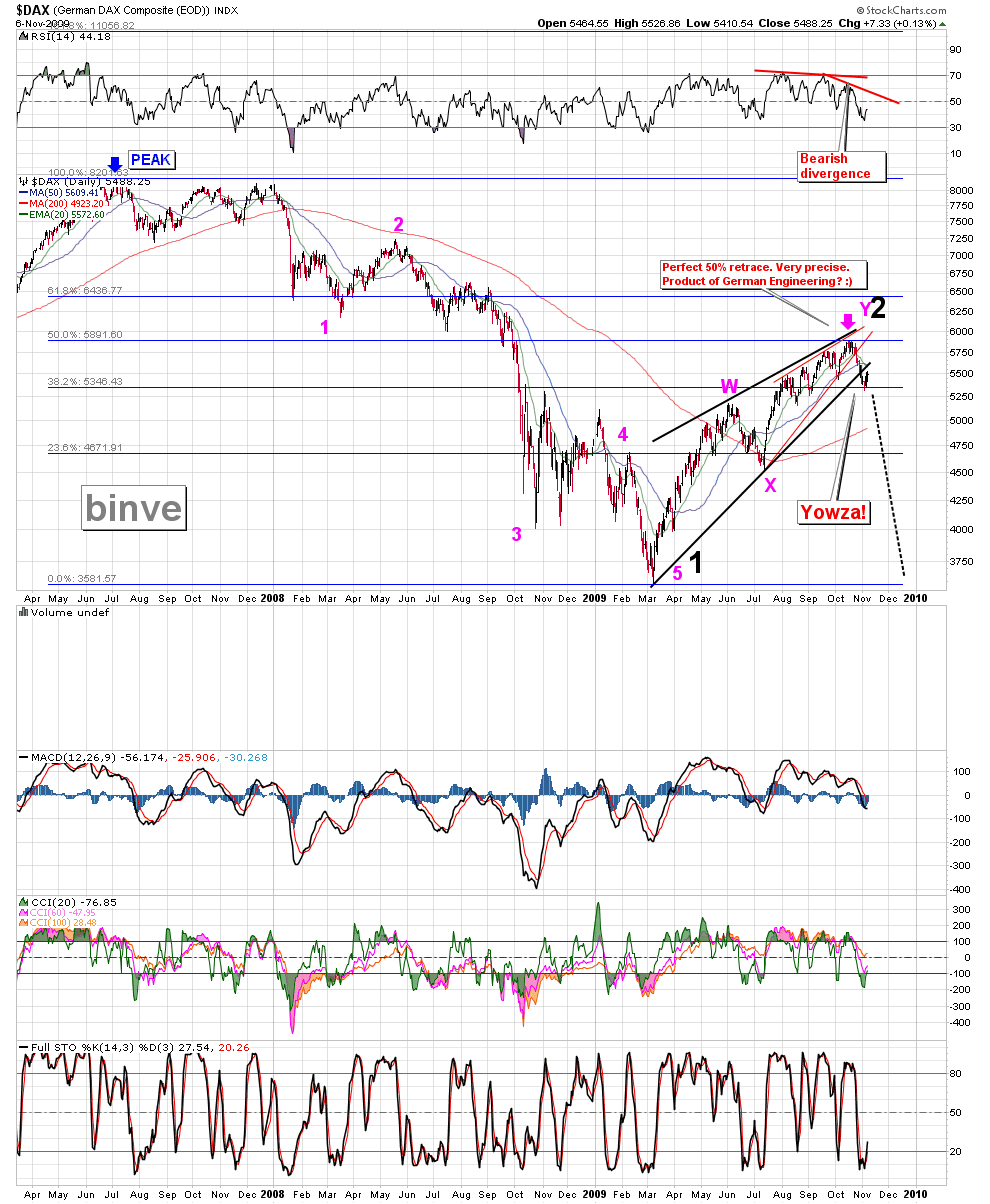
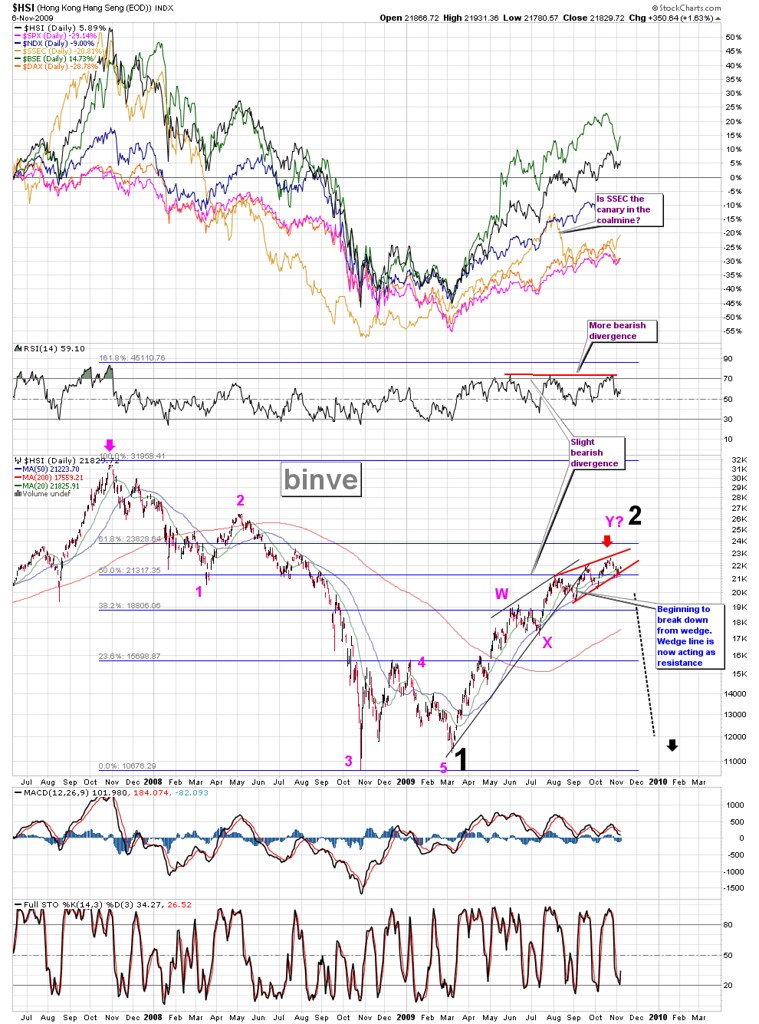
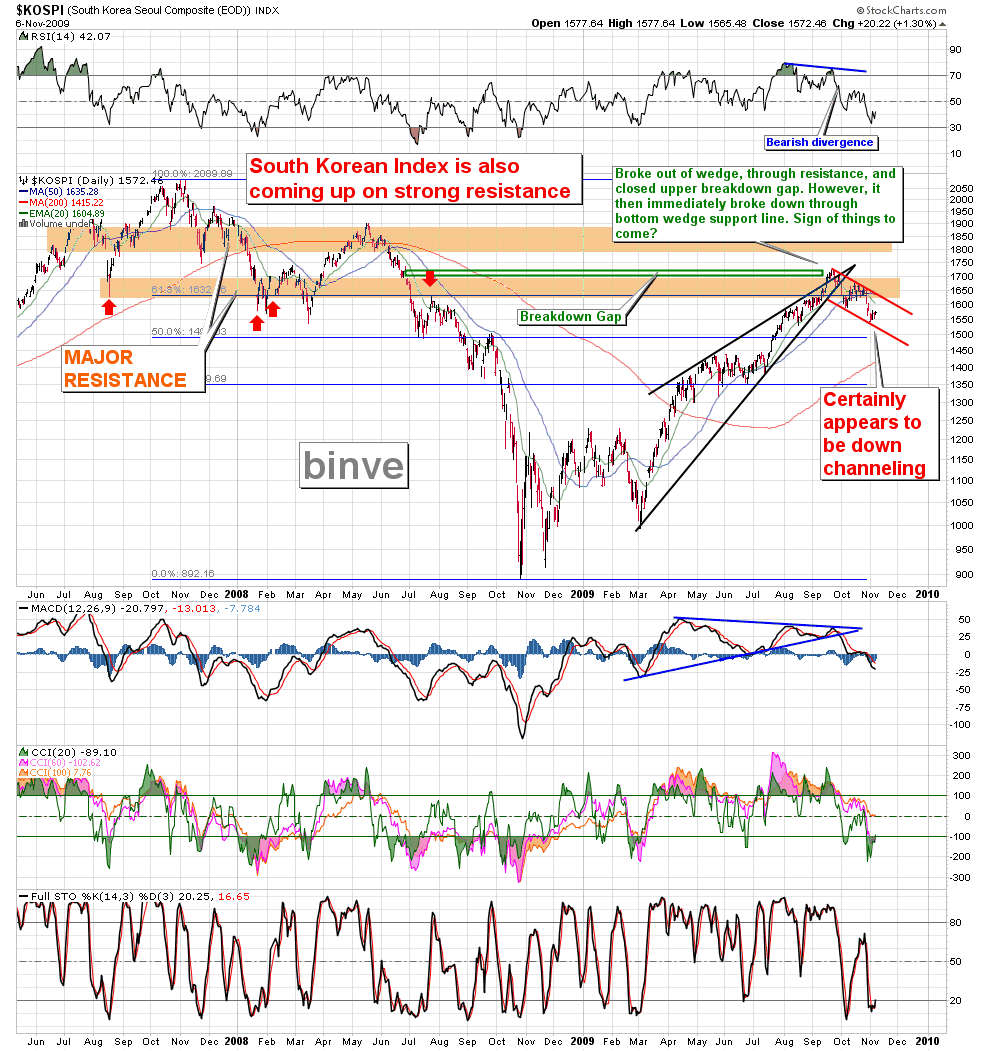
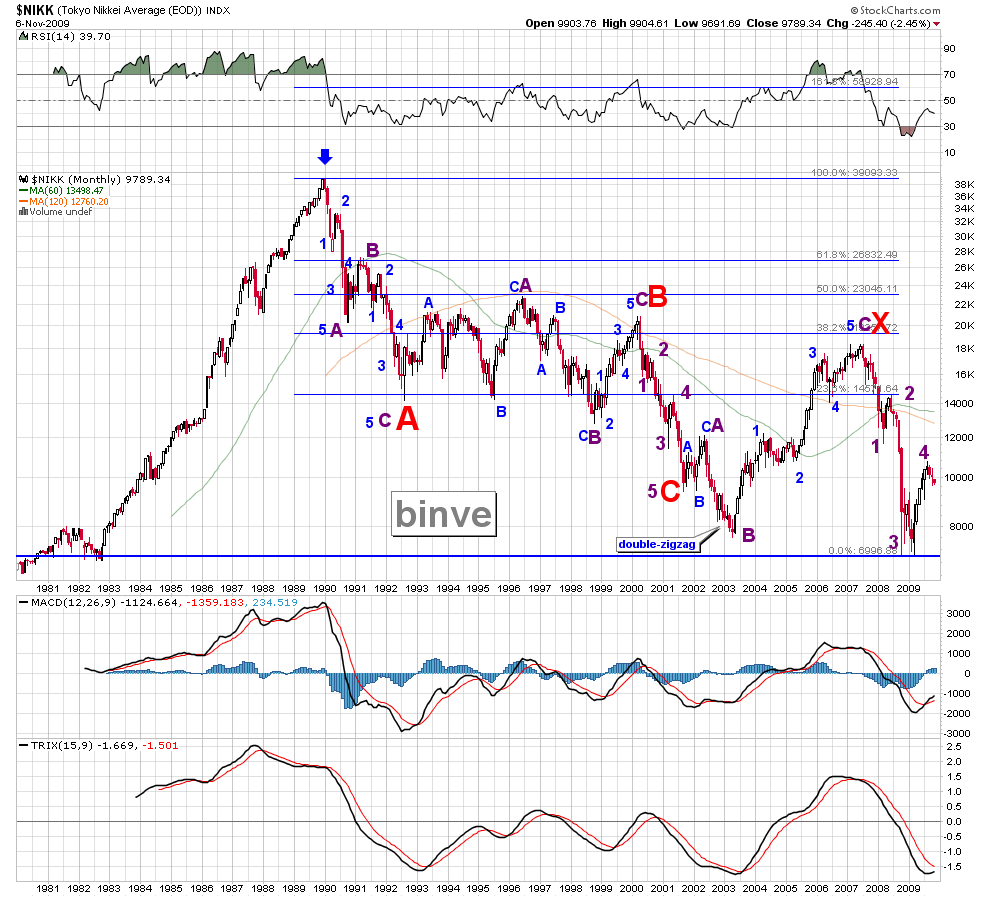
Important and International Indices
This should give you an idea how much momentum is waning over the globe in these indices. And some of the most speculative ones have seen peaks already and are either trading down or retesting.

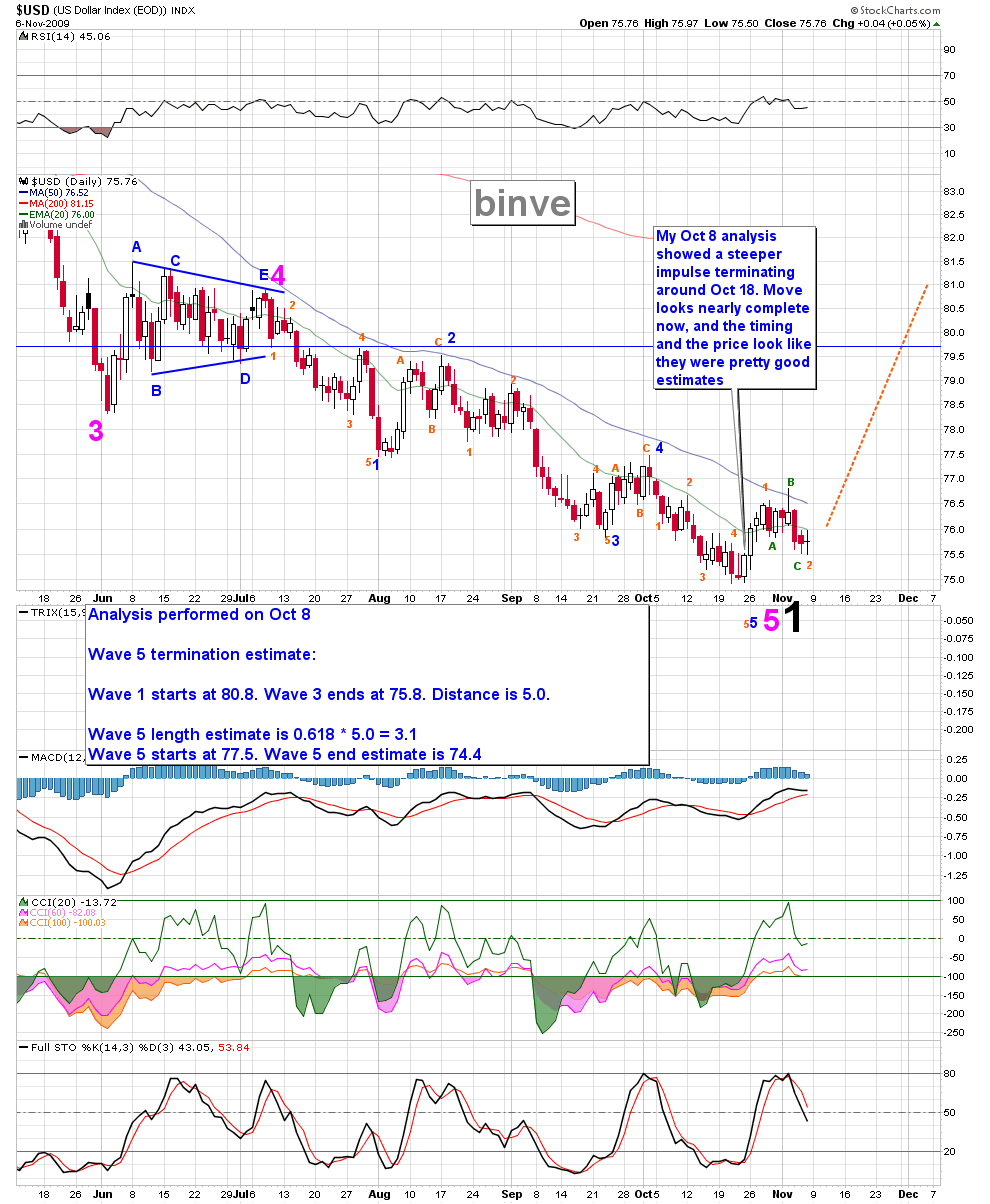
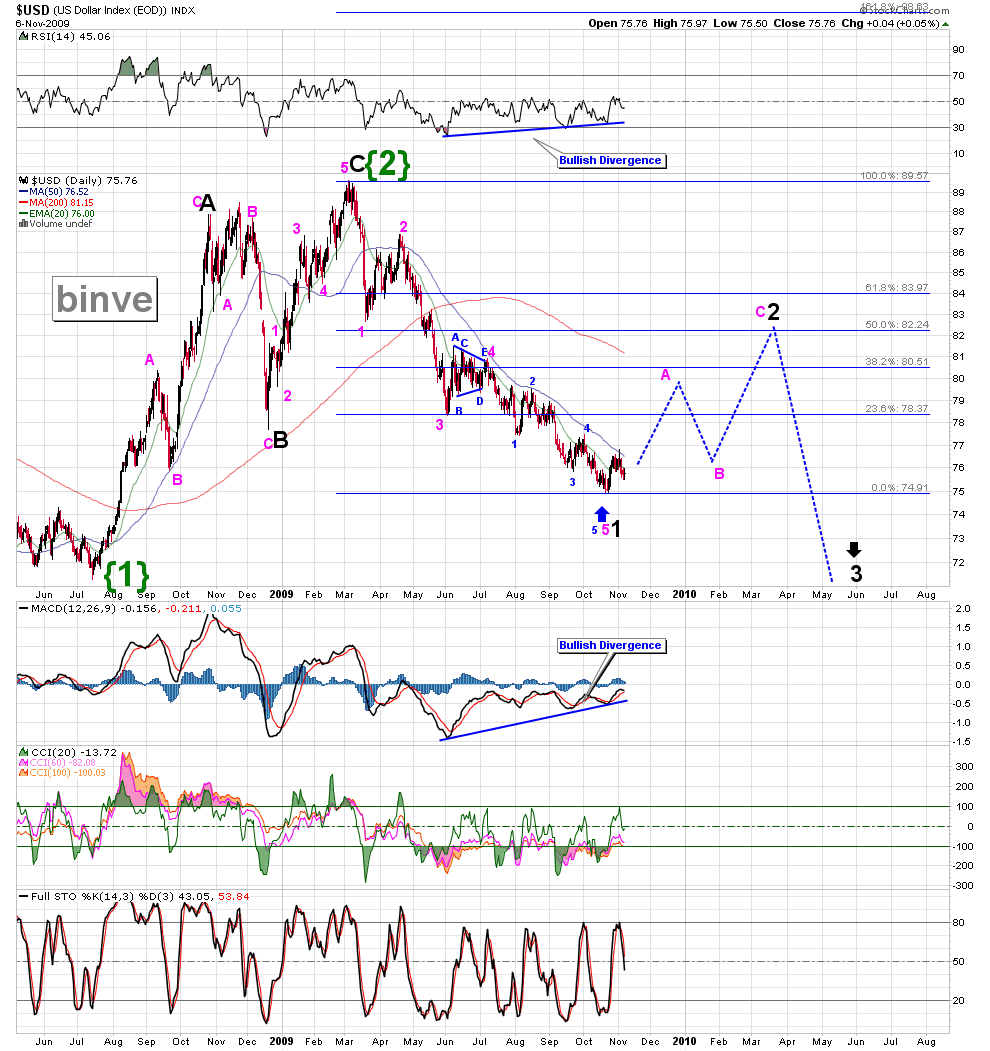
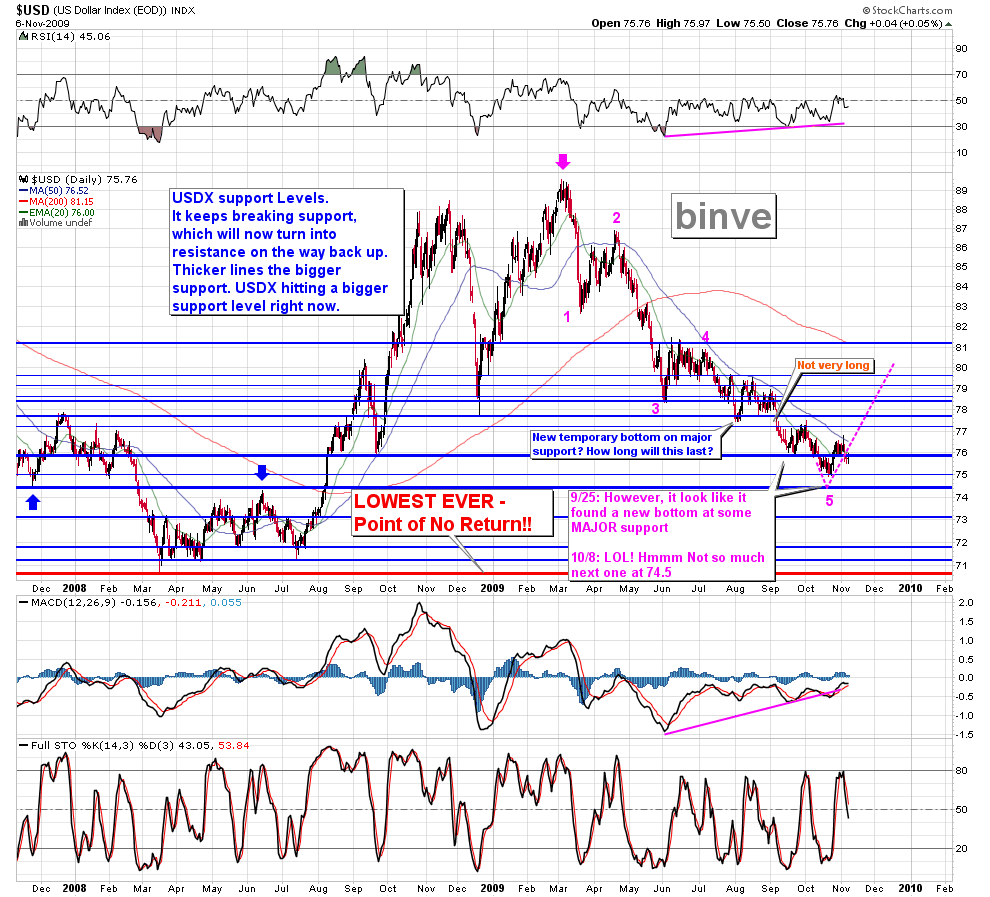
US Dollar
The weak dollar is helping to fuel the equity rally currently.
However, the often repeated notion, "Dollar Down = Stocks Up" IS COMPLETELY WRONG!!!
Dollar Down = Stocks up (and vice-versa) is true now based on a very particular macroeconomic setup. And it will *NOT* persist indefinitely. Over the long term, the Dollar and the equity markets are far more positively correlated than inversely correlated. And in the not too distant future both will be trading down together as they have done in the past.
Please read these posts of mine regarding the Dollar:
– Gold and US Dollar Counts – Nov 09
– Thoughts on the US Dollar, Analysis of the USDX Long Term, Follow up on the Gold Blog
Here is the Long Term Dollar/Equity Correlation as I was discussing above as well as a clear picture of the long term direction of the dollar


Fundamentals
They are exceptionally important so I put together a huge post that discusses them in great detail: The Long View


