
Historical PE Ratios: Marking the Tops of Economic Expansions (and Warning of Coming Economic Contractions)
Courtesy of Michael Clark
Robert Schiller recently posted a chart showing the history of American interest rates in the 20th Century and the history of PE ratios in American stocks.
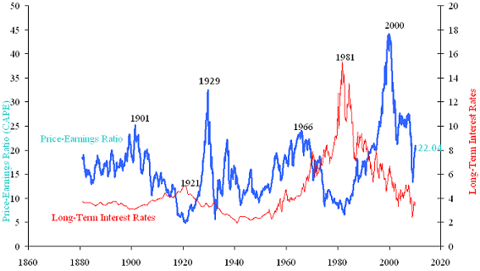
Note the similarity between the historical PE ratios (blue line) and our contention that financial cycles run in 36-year periods, top to top. We don’t agree exactly with the dates of economic tops in this chart — but we’renearly in agreement.
We have American economic cycles in the Twentieth Century exhibiting tops in the following years:
TOPS
1893
1929
1965
2001
BOTTOMS
1911
1947
1983
2019
Interest rates should be lowered as we proceed toward economic bottoms and should be raised as we proceed toward economic tops. Had we begun raising interest rates slowly as we approached 2001 then we would have avoided all this mess of this decade — and the coming decade.
We need to realize that Nature has patterns and cycles — and we need to put our human ego aside (the human desire to control nature) and work WITH these cycles, instead of against them.
We CANNOT have perpetual economic expansion in a system that has dual movements of expansion AND contraction. Inflation needs to be followed (each time) by deflation. Our view that inflation is GOOD and deflation is BAD may be true for the rich in the nation but it is not true for the society as a whole.


