
$8 per Gallon Gasoline Is Already Here (for some of us) & Two Charts: the Dow and Dow/Oil
Courtesy of Charles Hugh Smith, Of Two Minds
$8 per Gallon Gasoline Is Already Here (for some of us)
I recently wrote about the possibility of $9/gallon gasoline in the U.S. $8/gallon gasoline is already a reality for some global consumers.

Correspondent Bram S. from The Netherlands recently submitted this insightful response to Adaptation, Habituation, Consumption and $9/Gallon Gasoline.
Bram observes that gasoline is already $8/gallon (when converted from liters priced in euros) in The Netherlands, yet auto owners still spend hours every day commuting to work.
And this is a small nation with an extensive (if expensive) pubic transit system.
To the degree that every dollar/euro/quatloo spent on petrol/diesel is a dollar/euro/quatloo which is not available to be saved or spent on other goods/services, it is in effect a tax (notwithstanding the high taxes already tacked onto petrol/diesel in most of the EU nations).
Why would people continue to drive despite massive financial disincentives to do so? Could the high cost of housing be a factor, as Bram suggests? Or is personal transport so addictive that we are like the lab rats who famously starved themselves to death by continually pressing the button which released more cocaine for their "enjoyment"?
That experiment may be apocryphal, and I mention it only to suggest that there are clearly powerful emotional attractors involved in our decisions to own and drive autos. That is, it is not only a financial decision. But could the economy/society be modified structurally to bring work and home closer together, or to at least ease the financial and social decisions to move the two into close proximity?
Here is Bram’s informative commentary:
I read your story about fuel prices today. Here in the Netherlands the fuel prices are skyhigh, but everyone is still driving his metal cubicle and waiting patiently in traffic jams. Talking about the rise of hidden taxes. In 1993 it was 46.1% tax. Now in 2010 it is 72% on gasoline.
Gasoline Excise Tax (Netherlands)
(If you are using the Google Chrome browser, just click the "translate" button in the top banner to read the entry in English)The price per liter gasoline today is EUR 1.579 of which EUR 1.14 is tax….. In dollars per gallon: 7.95. Almost your estimation but no one takes the bike or horse or cable car.
Current fuel prices (Netherlands) The Netherlands has the highest tax on fuel in the world. Two-thirds of the Euro95 liter price consists of tax, legal and tax levy. The rest of the liter price is primarily determined by crude oil.
We also have some nice roadtaxes: EUR 600,- for a normal average gasoline car per year. But for diesel you pay EUR 1230,- per year.
And on top of that we have a VAT of 19% and if you get a new car our government puts another 27.4% on top of the VAT. They call it BPM. So the price of a new car consist of almost 50% taxes.
But we are not finished yet. If you drive a company car the government puts 25% of its value (yes including these 50% taxes) on top of your income. And income taxes are also pretty high here: 38%. But if you read this story about the average Joe in the Netherlands he pays not 38% but 52% of its income on taxes….
The tax burden in the Netherlands
So, it is time to opt-out of this crazy system!
I think one of the reasons why people stick with their car is that they don’t move to where their work is. Because of the high housing prices (still), personal troubles with moving to another town, family things. So for people in Holland its normal to drive 3 to 4 hours a day to get to their work. Talking about efficiency and the stupidity of the 9-5 working hours. It’s almost modern slavery….
Despite the tremendous taxes, public transport is really expensive. So where are all these taxes going to? I guess its the banking sector 😉
Thank you, Bram, for this insightful commentary.
******
& Two Charts: the Dow and Dow/Oil
Two charts reveal much about the current Wall Street rally in equities.
Frequent contributor Harun I. provided two self-explanatory charts which shed light on the current rallies in the stock market and oil.
The first is a long-term snapshot of the Dow Jones Industrial Average, showing its 11-fold increase from the start of the Great Bull Market in 1982 to the present "nascent recovery." As Harun notes in his comments, credit default swaps have risen 10-fold since the dot-com bubble burst; CDS can be viewed as a rough measure of leverage and risk-gaming.
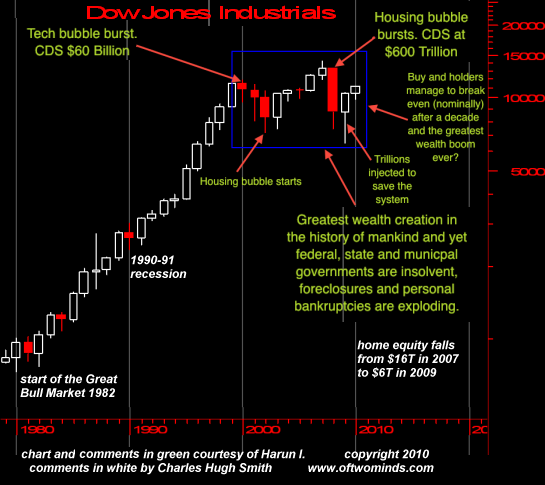
One dollar in 2000 is $1.26 in 2010 dollars, hence Dow 11,000 in 2000 is equal to Dow 13,860. Thus even as the Dow has returned to 11,000 nominally, the value of those shares has declined 26% in the past decade.
Harun illustrates purchasing power with this Dow/Oil ratio chart. In essence, even as the Dow has risen some 70% from 6,550 to 11,200 (a 4,650 point rise), the amount of oil a share of the DJIA can buy has remained more or less the same as when the Dow was still 8,000 in 2009.
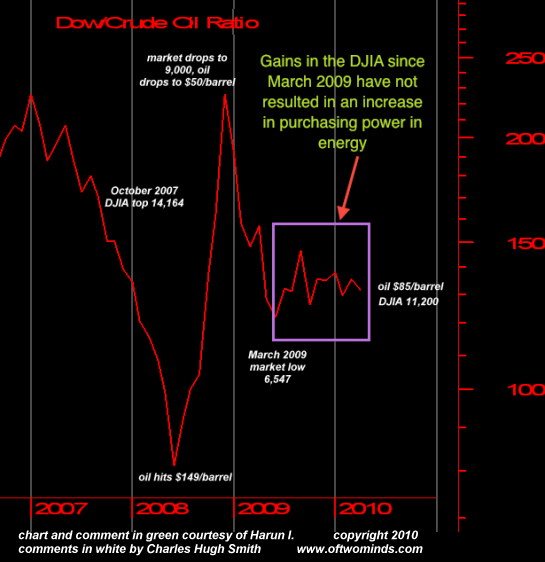
Thank you, Harun, for these enlightening charts which remind us that nominal prices are not the final arbiter of value or purchasing power.


