
Courtesy of Benzinga
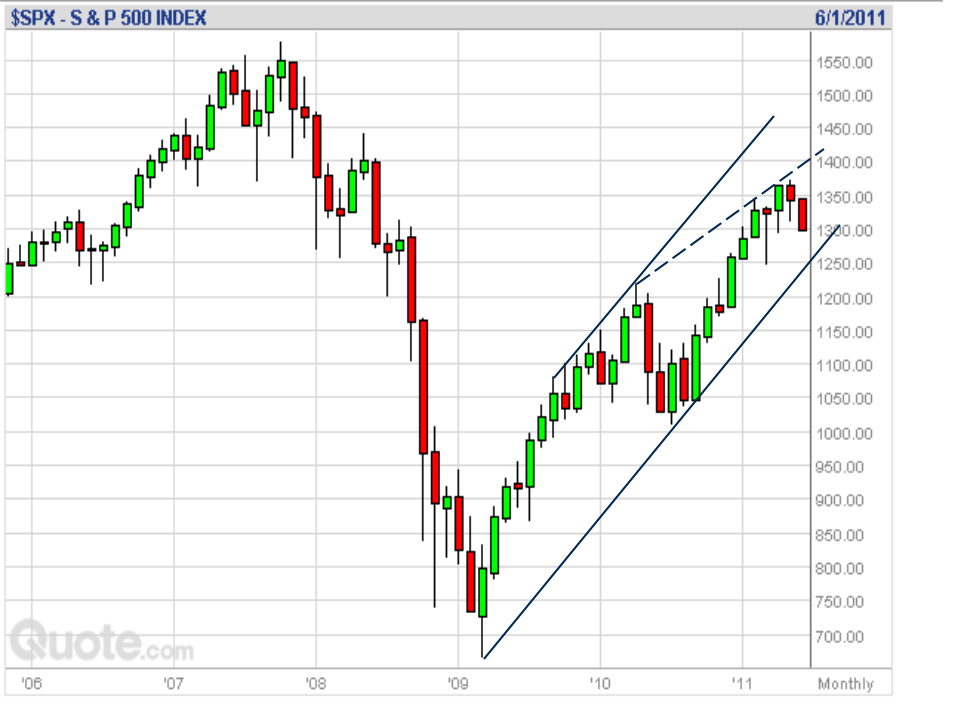
In the attached chart [ SPX 500 Monthly ] we can see that the Price action, since March 2009, has been confined to an ascending channel. At this time the upper boundary is at 1515± and the lower boundary is at 1250 ±. It is believed that the Index is headed for 1250 ± . The chart shows one internal rising trend line that is defined by a series of increasing high points . The Index reversed off this trend line as is presently under going a correction that will probably involve a test of the lower boundary before there will be a reversal even though the indicator [ modified Idiot ] is still indicating a BUY. On such a reversal the internal trend line will be the initial target. This prediction is confirmed in various analytical methods. The limiting to one chart is a bit of a nuisance but I will give an URL where those interested can obtain additional information on indicators and some of the methods used in this report. The Indicator the Idiot, on most time periods, is still indicating a SELL which indicates that there is still more downside before the correction is completed. On the shorter [ < 1 day ] time periods the Canary 6 is indicating that a reversal is on the menu. The daily Bi BB’s chart shows that the Price reversed off the MBB [ 1289.59 ] and has now closed [ 1268.45 ] on the LBB (20,1) [ 1268.45 ]. A break below this level will set the LBB (20,2) [ 1247.31 ] as a target. The calculated PVP Monthly support levels are S1 [ 1314.47 ] , S2 [ 1283.75 ], intermediate point [ 1254.36 ] and S3 [ 1244.97 ] . With the Index having dropped through levels S1 and S2 the immediate downside target is 1254.36. In the coming week of June 27th, the calculated weekly support levels are 1254.36– 1240.90 and 1205.16 . The Daily values for June 27th are 1262.48 – 1256.52 – 1239.83 and 1223.14. The Weekly Planet Price levels are 1320.76 – 1289.31 – 1276.59 – 1260 and 1243.90. Again the support values fall in the same “ball park”. Assuming that this down leg is not completed one can calculate potential down side targets. These targets are 1263.59 and 1241.95. Now we come to Fibonacci analysis and I will cover two price rises . The first is a long term [ 1982 – 2007 ] where the Index rose from 102.40 to 1576.09 . The significant levels are 1284.41 – 1260.72 – 1248.30 – 1244.46 and 1240.62. The shorter term involves the rise from 1010.91 to 1370.58 . The significant correction levels are 1285.67 – 1250.57 and 1233.20. if I add in L2 Fibonacci values we can add 1244.02 and 1239.88 to the series.
One can see that there is a strong similarity in the target levels developed using many widely different analytical methods. In the coming days the Index will test 1250 and possibly even lower levels before the correction has been completed.
The URL is http://www.theidiotandthemoon.com/index.html where one can find information concerning some of the indicators and methods used in this report.


