

By Dr. Andrew Stotz, CFA. Originally published at ValueWalk.
Disclaimer:
This example was created on February 22, 2017. This is NOT a valuation, forecast, rating, or recommendation; rather, it is a teaching example. What follows is NOT investment advice; rather, it is a teaching example. It is intended only as academic information to those who want to learn about valuation. It should not be construed as the basis for any valuation or investment. The information in this presentation came from various sources which we believe are reliable, though we do not guarantee the accuracy, adequacy or completeness of such information. We hope you enjoy learning about valuation as much as we do!
Background
AKR was born as a small chemical trading business over 55 years ago in Surabaya. It has since grown to become one of Indonesia’s largest private sector distributors of basic chemicals, petroleum, logistics and supply chain solutions.
AKR supplies refined petroleum products from international refineries to the mining industry, government power utility, industrial and commercial establishments and also to the retail sector through its petrol stations.
Today, AKR is the supplier of choice to industrial companies in the textiles, alumina, chemical, soap and detergent industries and supplies basic chemicals to the construction and consumer-related industries.
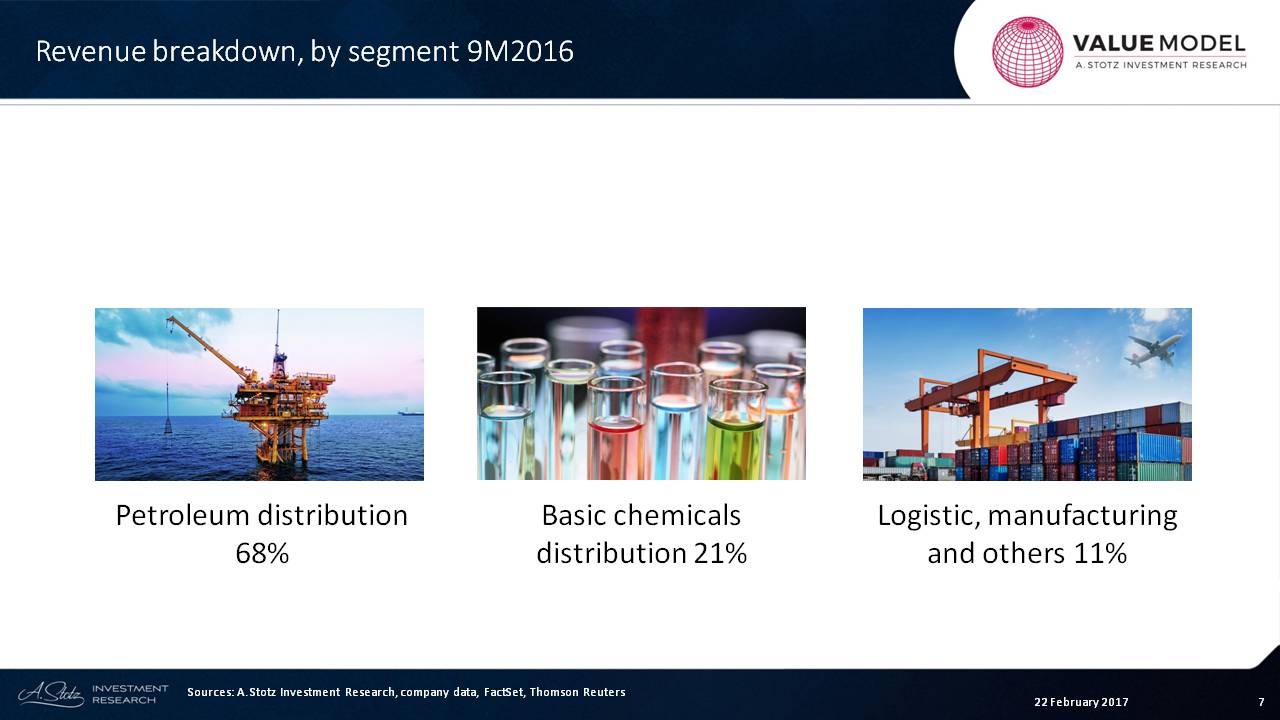
The 9-month 2016 revenue breakdown shows that 68% comes from petroleum distribution.
Forecast
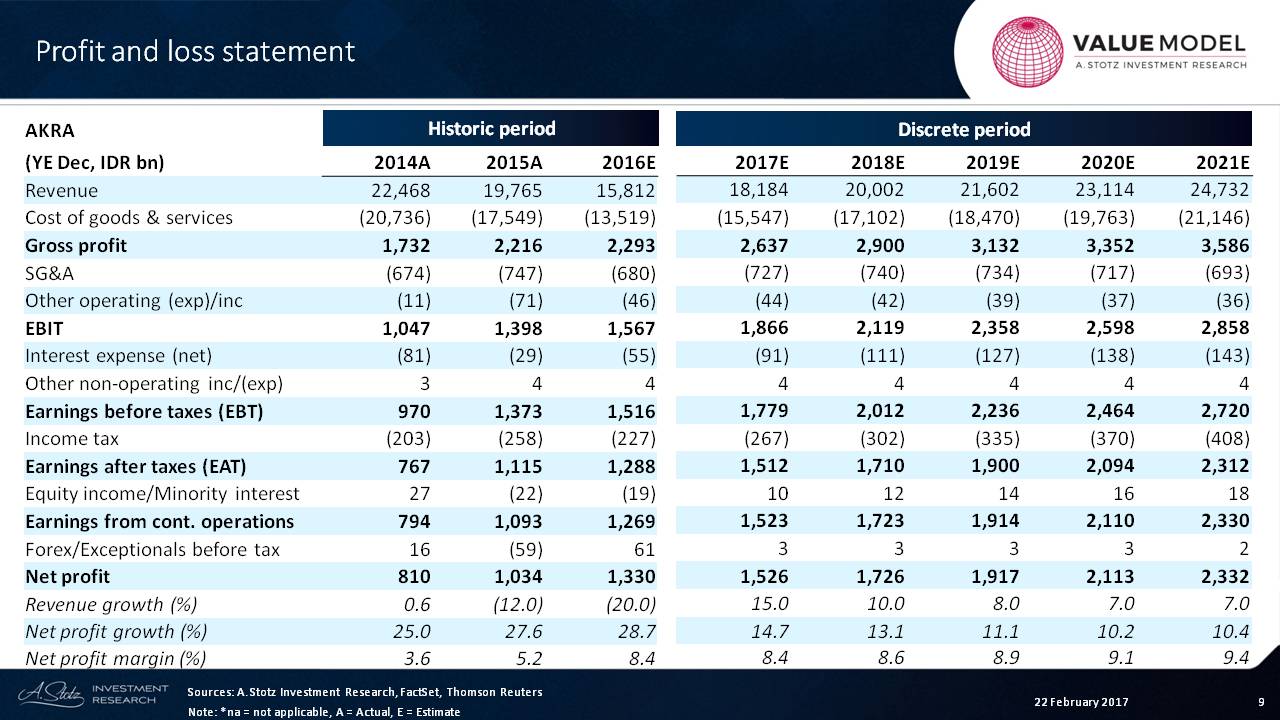
The first thing we can see about this company is that the revenue has been falling as oil prices took a dive. The net profit has been rising, however, which is very impressive in a falling environment.
The net margin, therefore, has risen to about 8.4%, and I’m going to keep it generally flat and up slightly for that period.
Assets
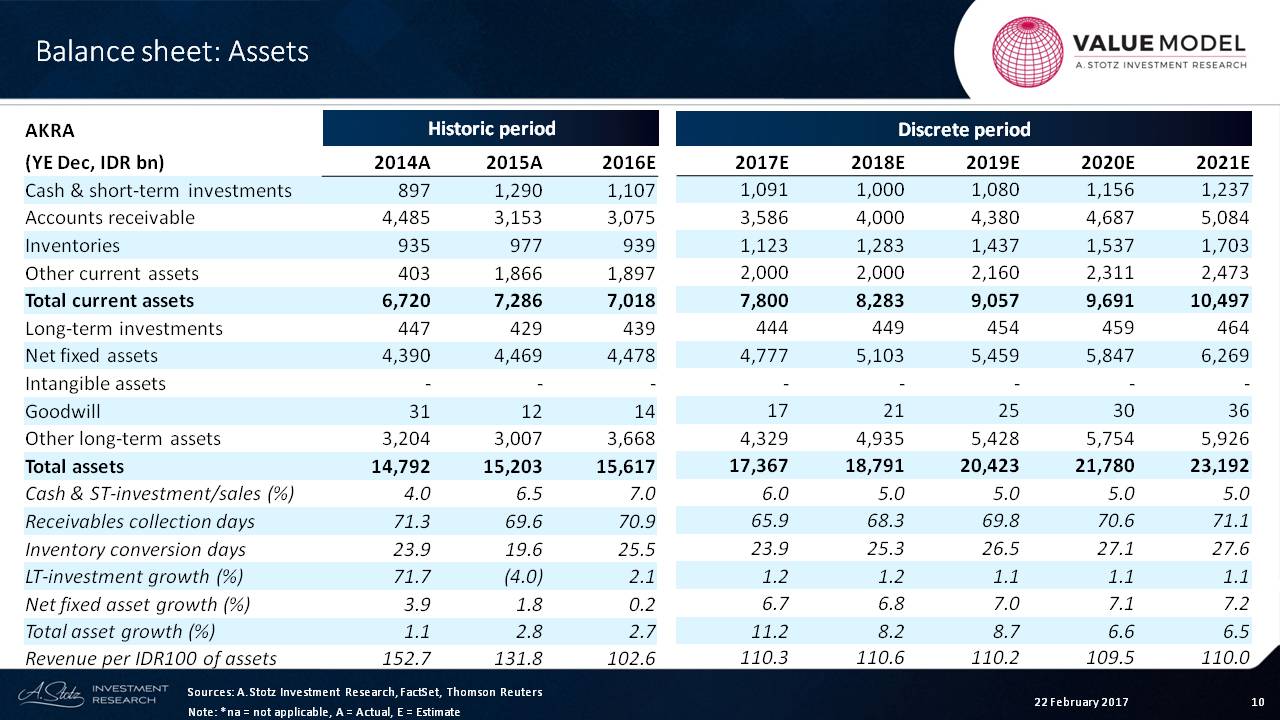
In the asset side of the balance sheet, we can see that the total net fixed asset growth is about 7%, and the total asset growth is in the range of 7% to 11%.
Liabilities and Equity
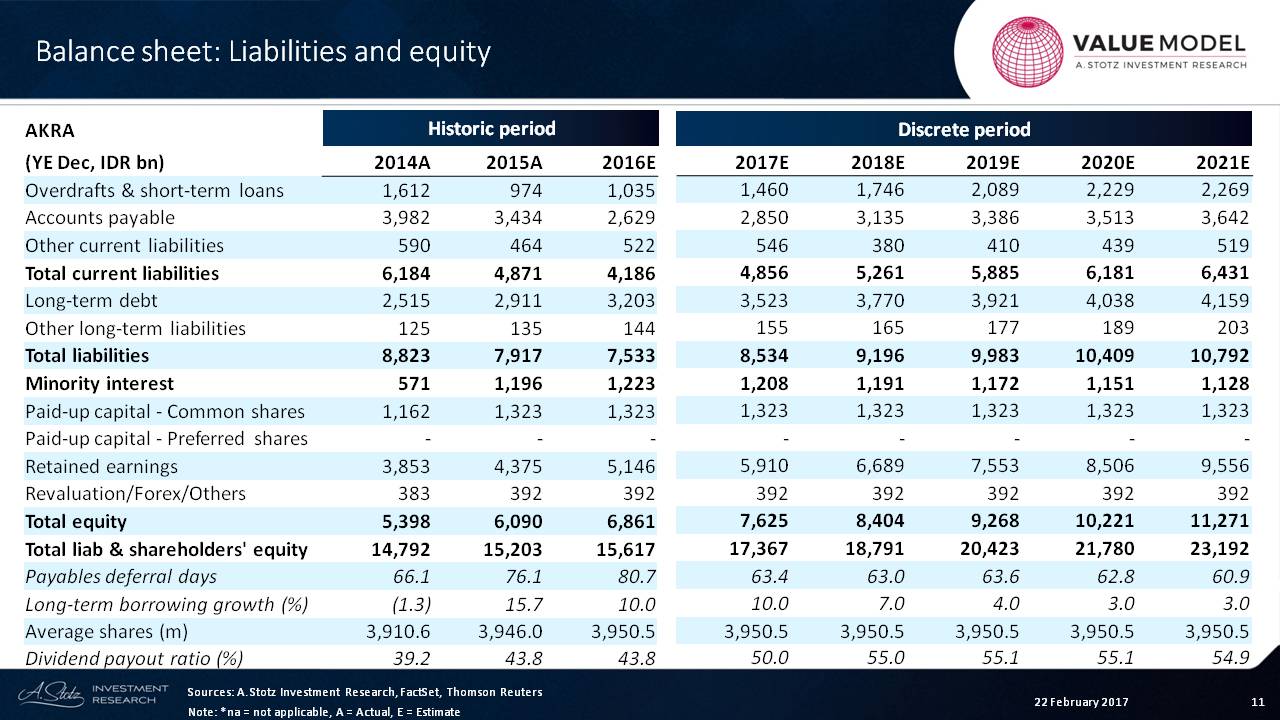
The amount of funding that the company gets is short term ? very small ? and they have a reasonable amount of long-term debt at about IDR 3,203 billion in 2016.
The dividend payout ratio is rising slightly, and I’m forecasting that it will rise in the future.
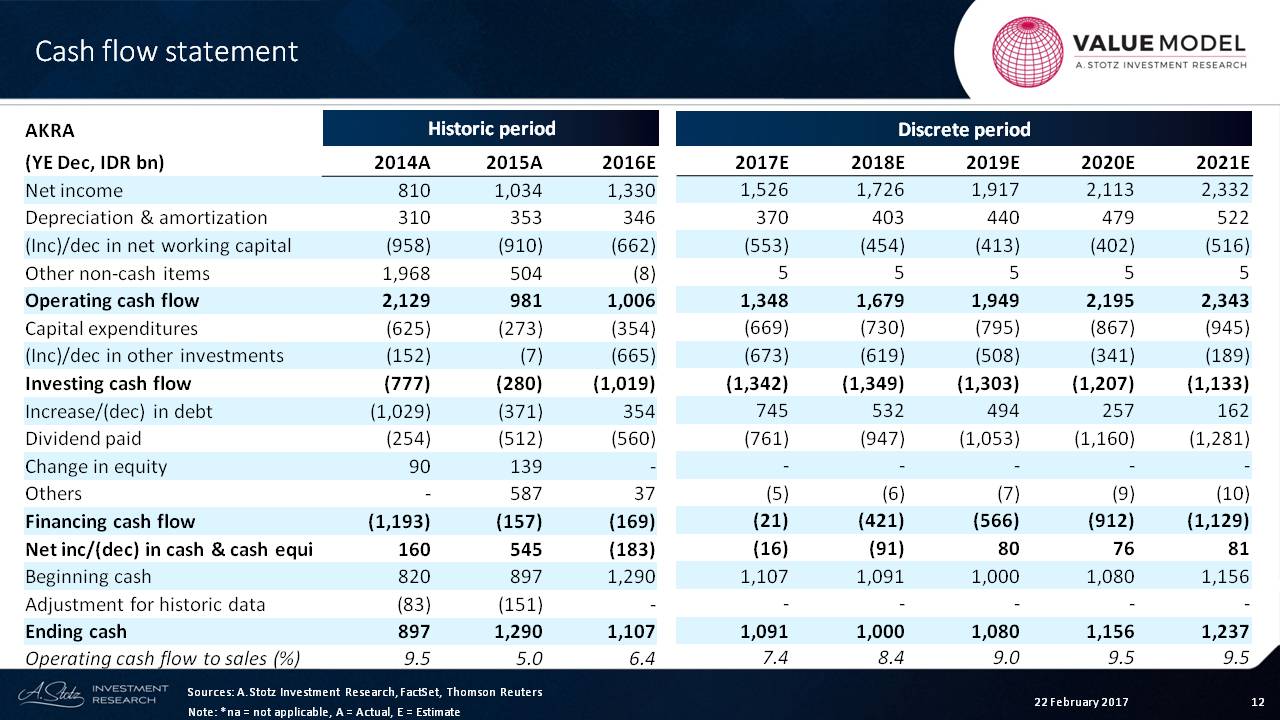
Cash Flow
If we now look at the cash flow statement, what we can see is that the operating cash flows are positive and rising over time. And we can see that the investing cash flows related to both CAPEX and investments are staying pretty stable over time.
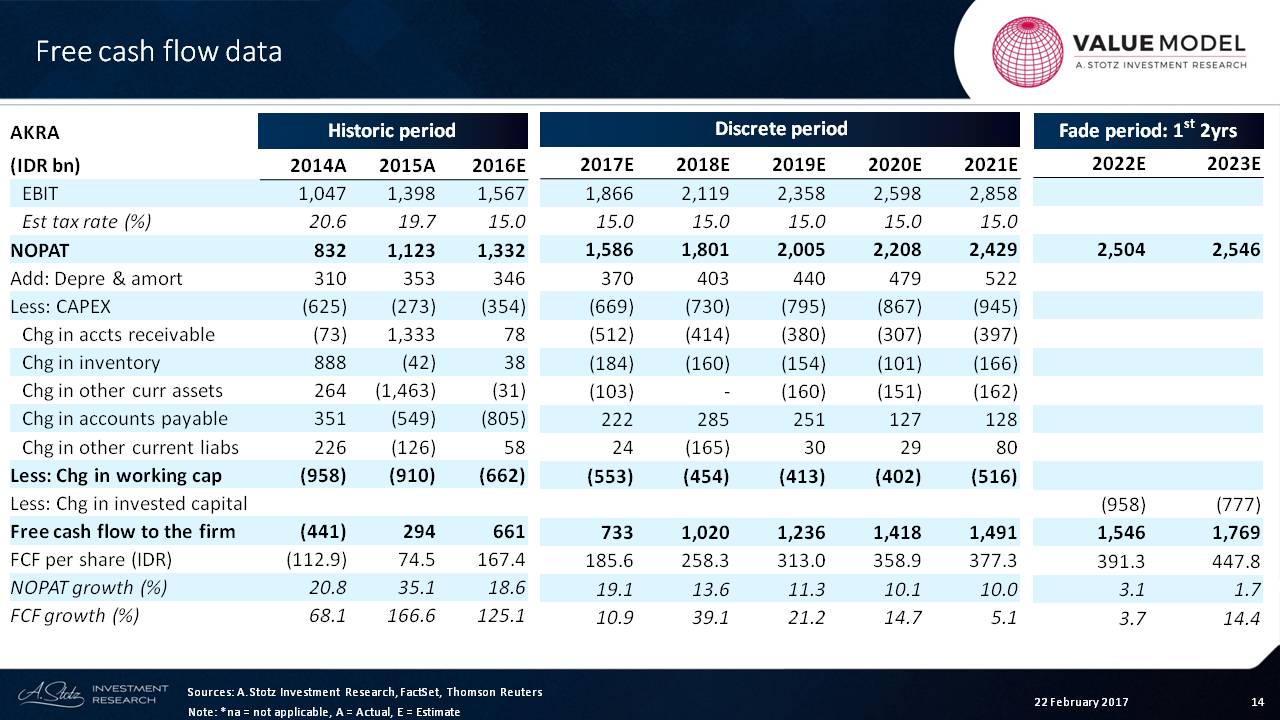
Free Cash Flow
Now, let’s look at the absolute valuation of the company. The first thing we want to look at is the free cash flow data. In this example, what I like to look at are the NOPAT, the amount of CAPEX that the company has, and the change in working capital.
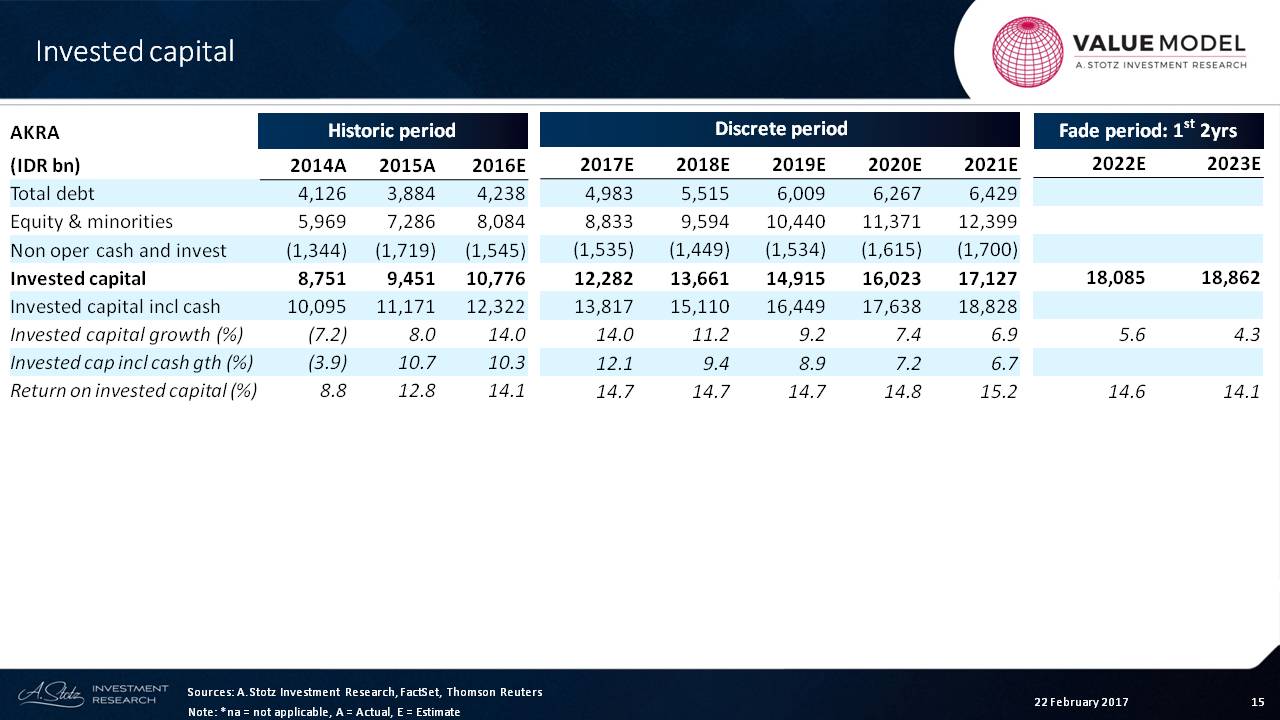
Invested Capital
From this, we want to look at the amount of invested capital in the business, and we can see that IDR 10,776 billion is the current amount of invested capital. We assume that that’s going to rise slightly.
So the return on invested capital has almost doubled, and we’re saying that it’s going to stay that way until we get to the fade period, where it will start to come down.
Per Share Data
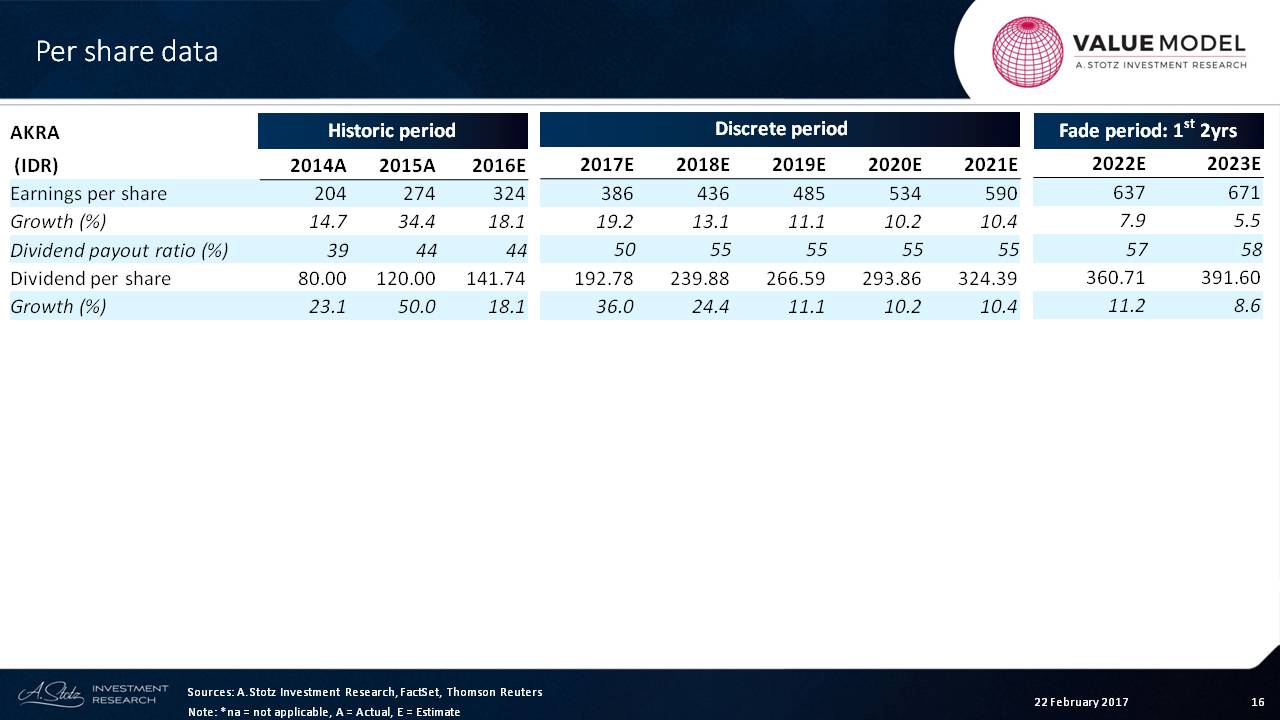
The earnings per share growth is about 10% to 20%, but the dividend growth is actually 36% in 2017 due to the increase in the payout ratio. Once again it’s 24% in 2018 because of another increase in the payout ratio.
Cost of Capital
Let’s look at our assumptions.
Remember that Indonesia is a high-interest rate country. Therefore, the risk-free rate is about 9% ? that incorporates that very high interest rate.
The market premium, which I’m estimating at 9%, gives me a market return of 18%. This is a pretty high market return in Asia, but it’s mainly driven by the fact that there are high interest rates for a long time in that economy.
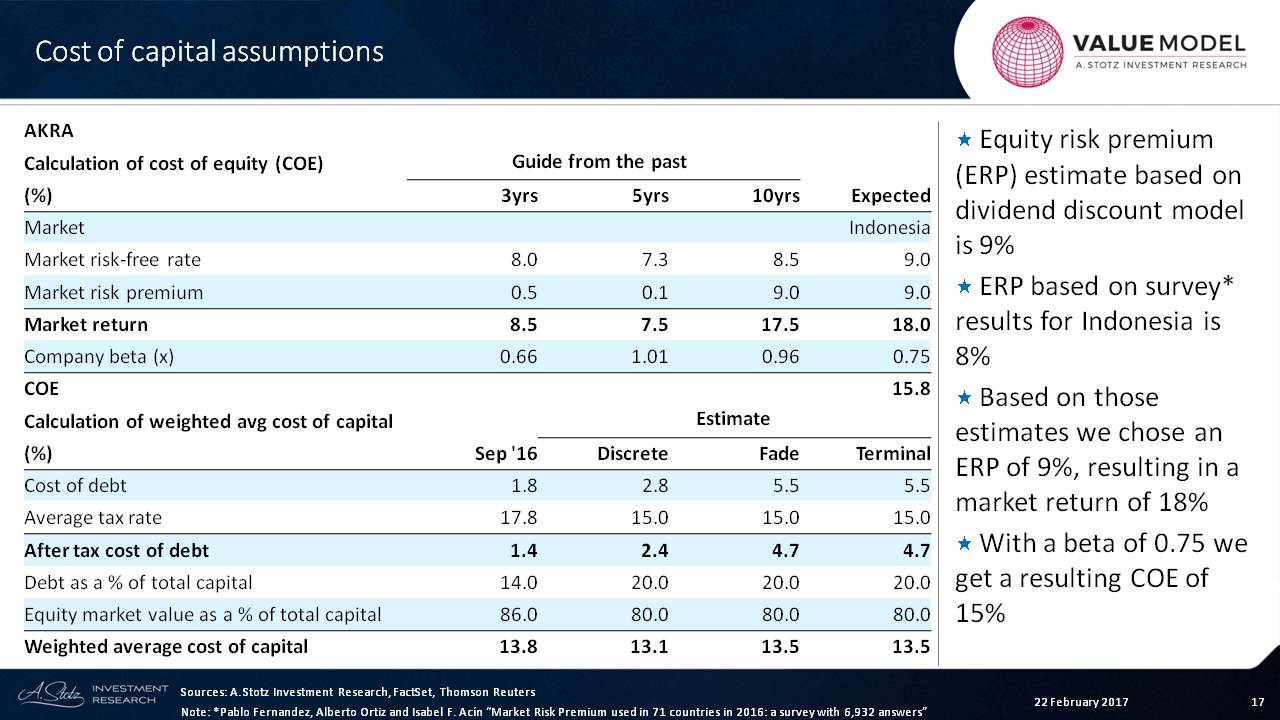
Now, the company’s beta is 0.75, which gives a cost of equity of about 16%.
If we look at the cost of weighted average cost of capital, we come up with about 13.5. So 13.5 to 15.8 is the range.
Terminal Factors
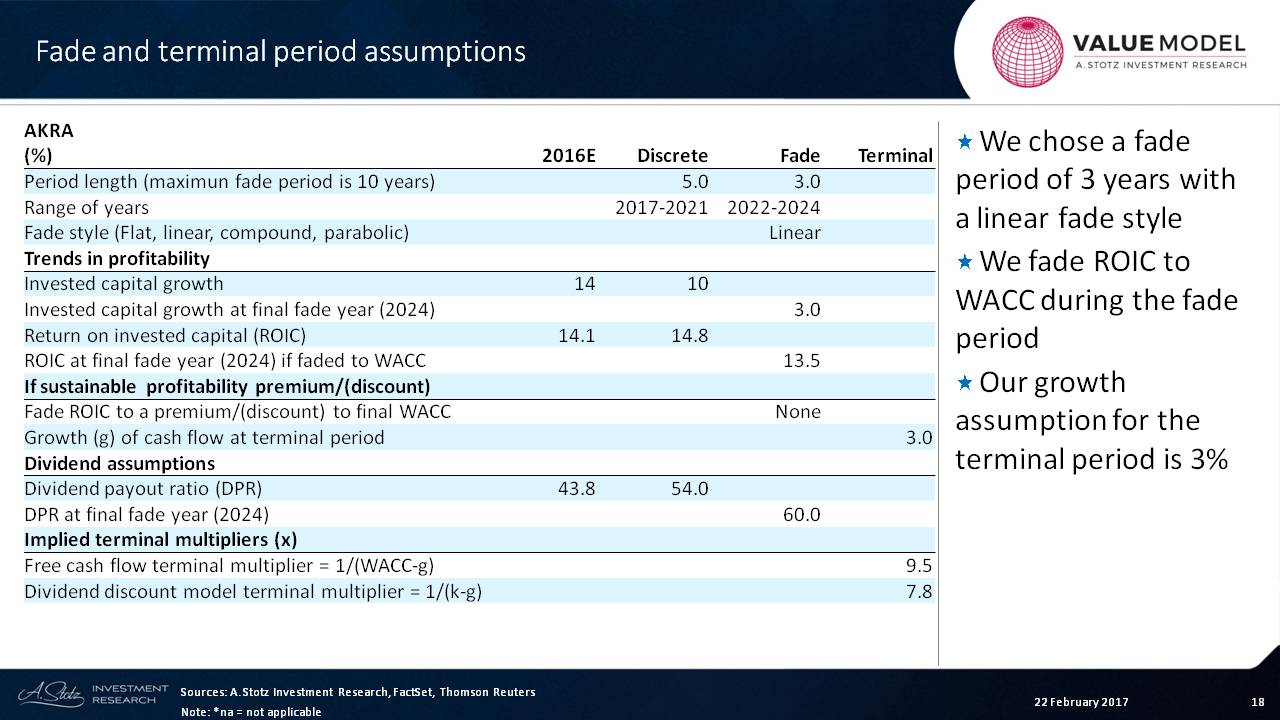
Here, we’ve taken a three-year linear fade, where the company can move down to normal profitability, and we’re fading that ROIC down to the weighted average cost of capital.
The growth assumption for the terminal period is 3%, and we can also see that the multiples for the terminal period are at 9.5 and 7.8, which are relatively reasonable.
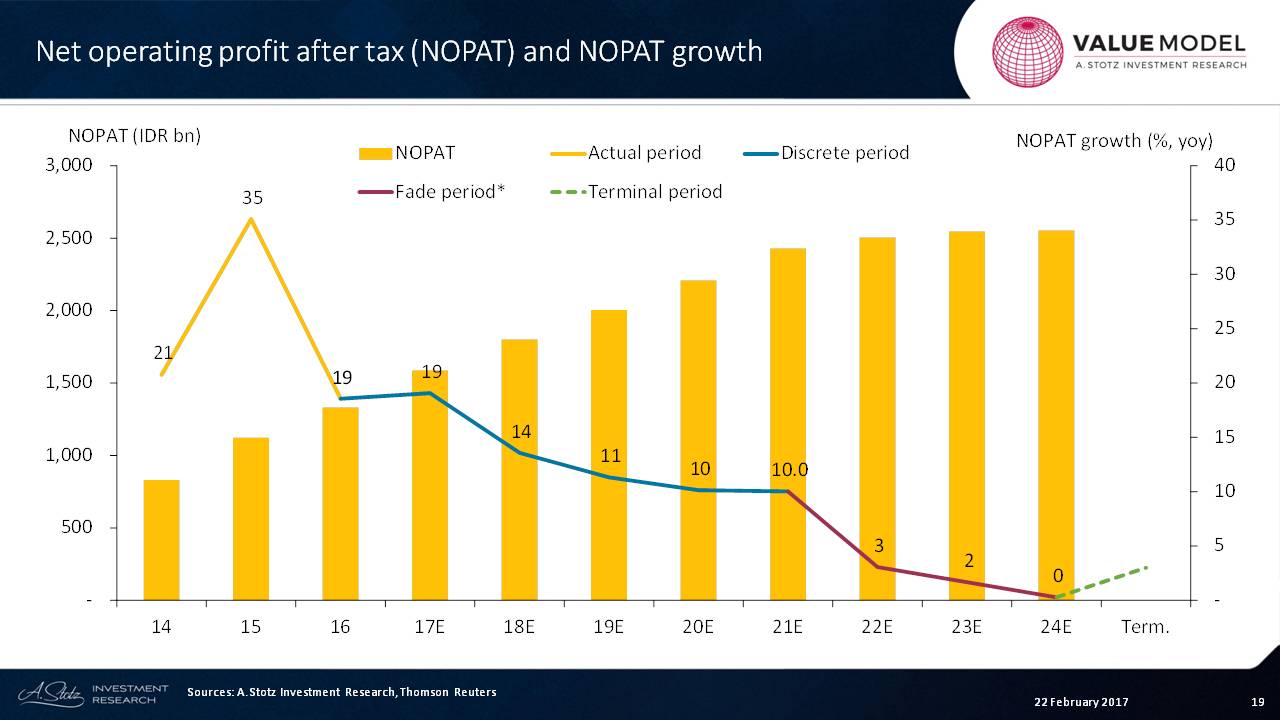
NOPAT
We can map that out and show that in the discrete period, we’re showing a rising NOPAT. Eventually, in the fade period, that growth slows down to be 3, 2 and 0. And then we move to the terminal period.
Absolute Valuation
First of all, the difference in value between free cash flow to equity and free cash flow to the firm comes from a higher value for the discrete period and the terminal period while the fade period has the same value.
What we can see is that the dividend discount model values the terminal period at 4 versus free cash flows valued at about 7 to 7.9.
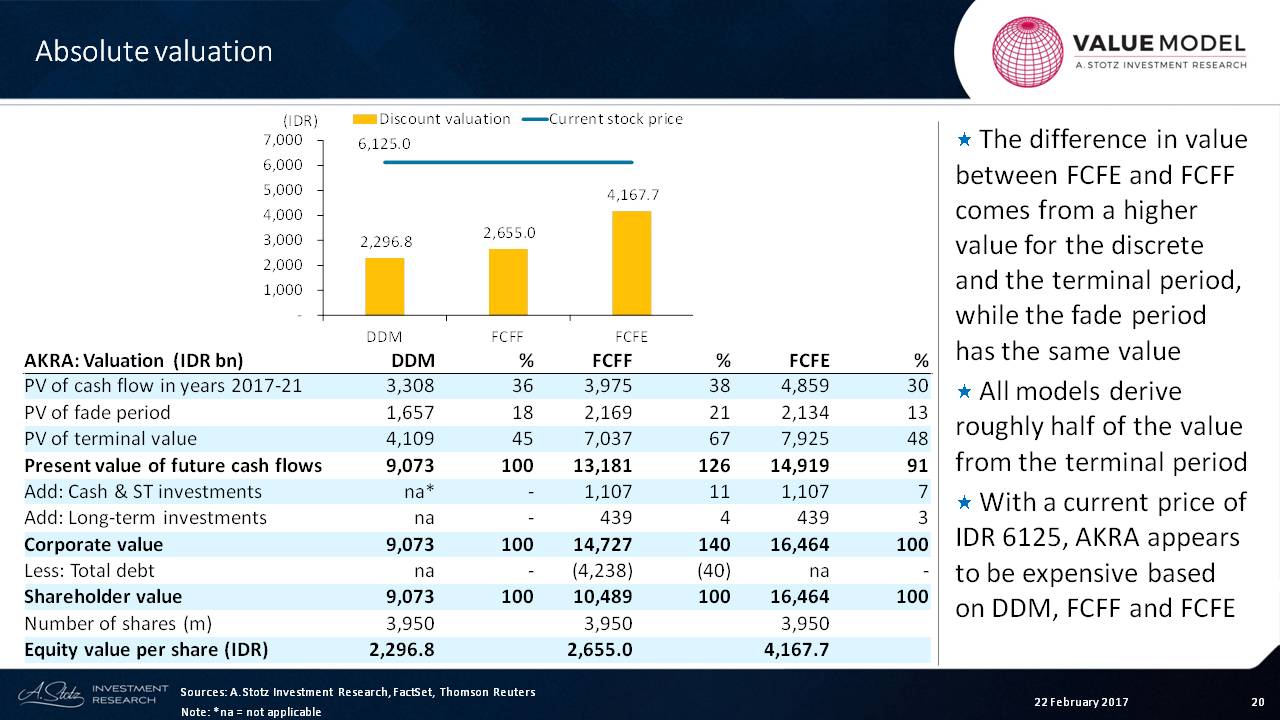
Of course, in the case of free
The post Learning Valuation: PT AKR Corporindo Tbk appeared first on ValueWalk.
Sign up for ValueWalk’s free newsletter here.


