

Courtesy of Declan
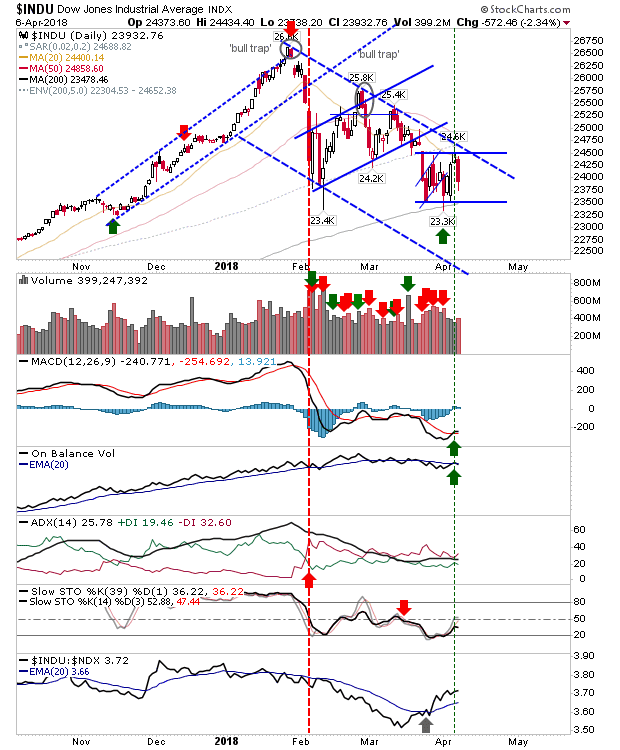
The earlier moving Dow Jones got pegged back a little as it fell inside its prior consolidation. Similar moves appeared for the S&P and Tech Averages, but as these were still range bound prior to Friday their selling was not as noticed. Markets are in a 50:50 tug-of-war between bulls and bears as these (now) 3-week consolidations work their way to a conclusion.
I have redrawn the consolidation for the Dow. Friday's mini-breakout could be viewed as 'bull trap' but I think it's probably fairer to broaden the resistance level for the consolidation. The 200-day MA again looks important but another test so close to its last maybe one too many. Volume climbed to count as distribution but overall volume was still quite light. Technicals are mixed.
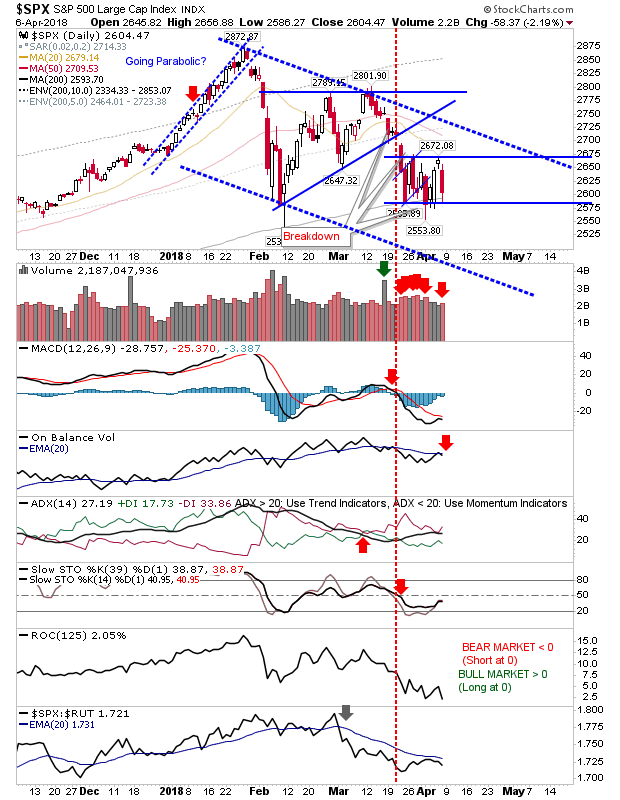
The S&P may be the better lead for the Dow Jones. Friday's finish did tag the 200-day MA but coming off a bearish reversal (on higher volume distribution) may be one struggle too many – time will tell as Monday will set the tone for the week.
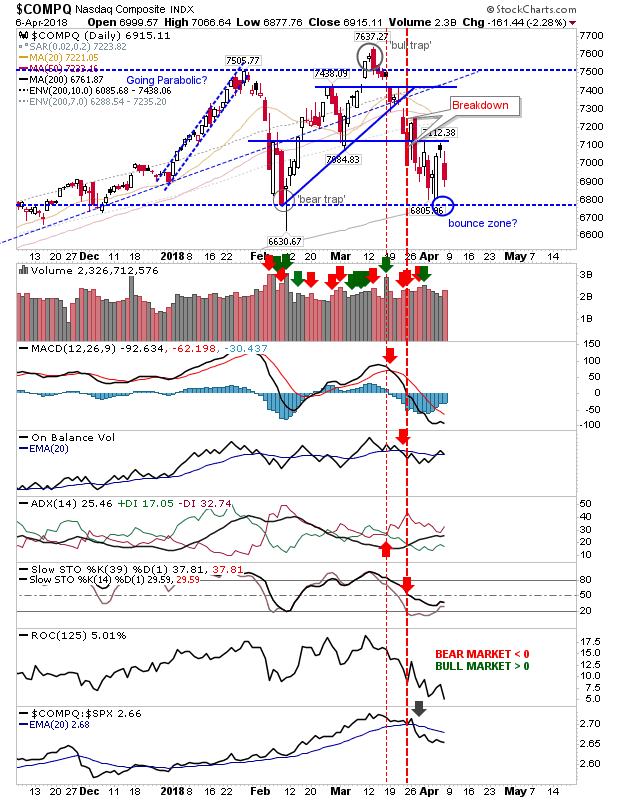
The Nasdaq experienced more significant distribution but hasn't yet seen a proper test of its 200-day MA. The convergence of the 200-day MA along with horizontal support from the February swing low looks key for the index and bulls' confidence.
The Nasdaq 100 also has some room to maneuver down to its 200-day MA.

Small Caps had looked ready to lead the indices out but have since got caught up in the market indecision. The 'bear trap' is still in play but it won't hold against another day's selling. Stochastics recovered from the traditional bull market support level (the midline of Stochastics [39,1]) so it will be interesting to see if this is a launch point for further gains.

The index which may be of most interest for Monday is the Semiconductor Index. It finished on rising support which had kickstarted a rally in February but has struggled to repeat in March. An undercut here still has the 200-day MA to lean on (a good place for some fishing GTC buy orders) and a bullish hammer or doji would make things very interesting.

Of the longer term charts I repeat this one of Andrew Thrasher's. The tag of the 50-week MA is looking a good opportunity for long-term buyers (even if it looks ugly on the Daily) given the last such test was mid-2016.

For tomorrow, how markets open will be critical for the Russell 2000 and Semiconductor Index. The 200-day MAs look like they will be key for all aforementioned indices; should this support fail there isn't a whole lot of nearby levels to work with; long-term buyers would only sniff interest when Large Caps and Techs are 5% below their 200-day MAs and really 10% is the marker to aim for. You are looking at February 2011 and July 2009 when similar such opportunities presented themselves although January 2018 was an early marker.


