

Courtesy of Benzinga.

Based on FedEx Corporation’s (NYSE: FDX) most recent earnings report, you’d think the stock would be performing better.
Not only did the company report an Earnings Per Share figure of $3.72 compared to the consensus estimate of $3.12, their sales figure of $16.5 billion also exceeded Wall Street’s estimate at $16.15 billion.
Beyond that, their EPS guidance estimate for the fiscal year came in at $15-$15.40, a huge beat of the $13.61 estimate.
Strong EPS, sales, and guidance? That’s usually a recipe for stocks to move higher. But not in this case.
Since its earnings report after the close on March 20, FDX is down about 4 percent. And it only looks to be getting weaker.
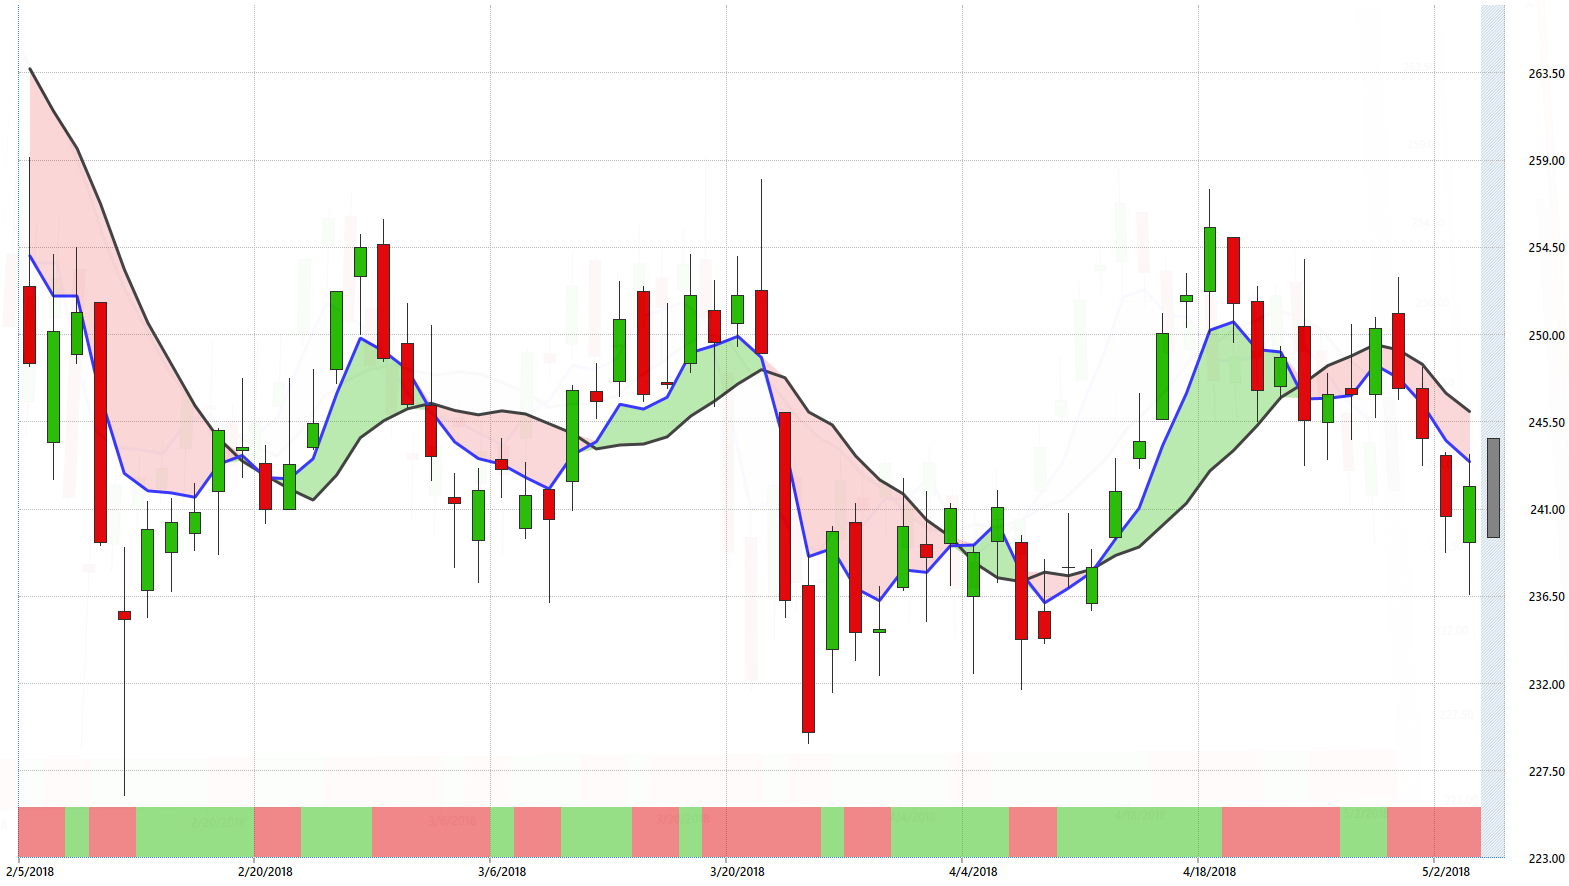
The charts below show this. They come courtesy of VantagePoint, an AI platform that uses intermarket analysis to predict future price action between 1-3 days in advance.
Both of the following charts show FDX over the last three months with each candle representing a day. We’re focusing on the blue line, that’s a predicted moving average.
In other words, since April 24 VantagePoint has been predicting FDX’s 6-day moving average would be lower in 48 hours than it currently is.
This next chart shows pretty much the same thing, but a little farther out. Instead of predicting FDX’s 6-day moving average 48 hours out, it predicts it 72 hours out.
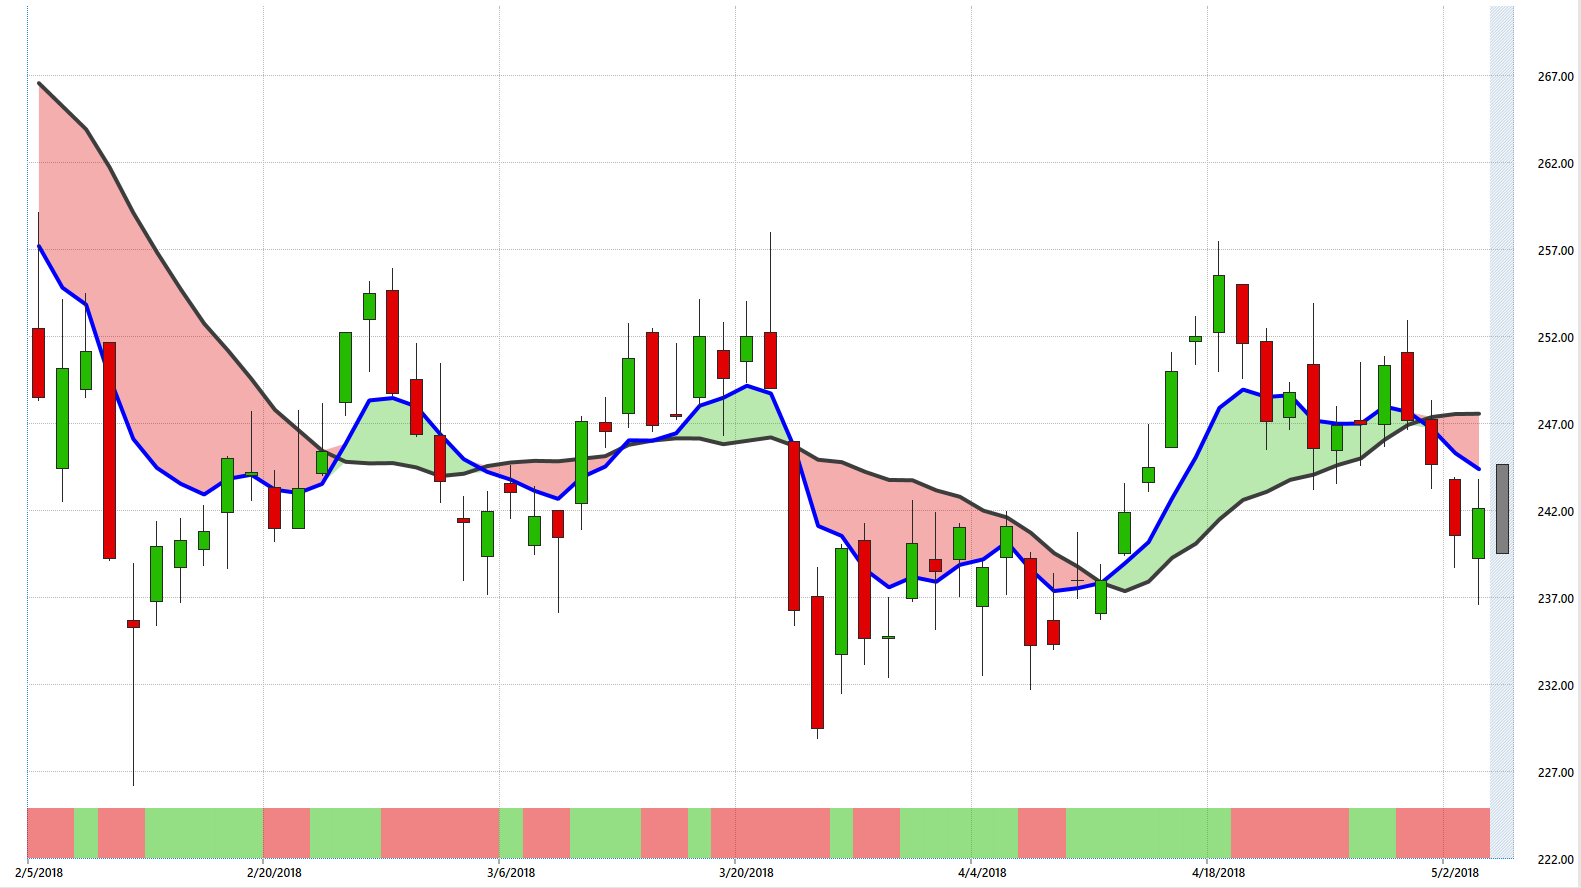
Note the trend shift on May 1. That’s a stronger confirmation because it’s telling us the stock will be weak until at least next Tuesday’s close.
On top of that we have the red-green bar at the bottom of the chart. That’s a Neural Index that measures strength and weakness for a 48-hour period. In this case, the move to the red position further makes the case for a potentially bearish scenario.
As of publication shares of FDX were trading flat from Thursday’s close.
VantagePoint is a content partner of Benzinga. For a live demo click here
Posted-In: vantagepointShort Ideas Technicals Previews Markets Movers Trading Ideas General Best of Benzinga


