

By Jacob Wolinsky. Originally published at ValueWalk.
Crescat Capital December 31 2018 update to investors below.
We are happy to report estimates for Crescat’s 2018 performance:


Profit Attribution by Theme

Investment Outlook Summary
September 20, 2018 should mark the closing high for the S&P 500 to end the second longest bull market in US history. It should also mark the top of the “everything bubble”, a term coined by investment newsletter writer Jesse Felder to describe historic valuations in every major asset class, commodities being the one exception. The everything bubble was courtesy of experimental global central bank policies in the wake of the Great Recession. We think it is only the beginning of the asset bubble bursting process brought on by the sheer extent of the bubbles themselves. In other words, we are likely to face the real-life playing out of economist Hyman Minsky’s “financial instability hypothesis” which portends much more unwinding still to come. There is a natural economic cycle, including a natural business, market, liquidity, and credit cycle which are all intertwined. While no one can predict the lengths and inflection points of these cycles with perfect precision, our goal is to time them as best we can to be prudent stewards of our clients’ capital and grow and protect it over the long term.
Our macro model is telling us that the bull market has finally topped out for this cycle and that the economy will soon follow. The central bank liquidity tide is going out while equities, fixed income, real estate, and private asset vehicles are all at historic valuations. We strongly believe there is still ample opportunity to capitalize on the everything bubble meltdown in 2019 through select shorts positions and “proper” defensive longs. The extreme macro imbalances have only just begun to unwind based on:
- Record global leverage compared to global GDP;
- Only-recent record US equity valuations across eight comprehensive measures;
- Recent record financial asset valuations relative to GDP in the US;
- A record currency and credit bubble in China;
- Historic housing bubbles in Canada and Australia;
- Record cheap valuations for precious metals and related mining stocks;
- The second longest economic expansion and second longest bull market in US history;
- Recently historic US market-top indicator levels on Crescat’s 16-factor macro model;
- Lack of widely recognized global recession with corresponding low equity market valuations, investor despondency, and capitulation necessary to signal a cyclical market bottom;
ecord Global Leverage
Global debt levels remain historically elevated and, in most cases, significantly higher than levels prior to the Great Recession. Looking at a list of all countries tracked by the BIS and the IMF, almost half of them are above the 90th percentile today in terms of their historical total debt-to-GDP ratios. See the chart below for the 26 economies today on the left panel that have debt to GDP at or above the levels that preceded those of the largest credit crises in the last 30 years. The year, country, and debt levels that preceded those crises are shown in the right-hand panel.

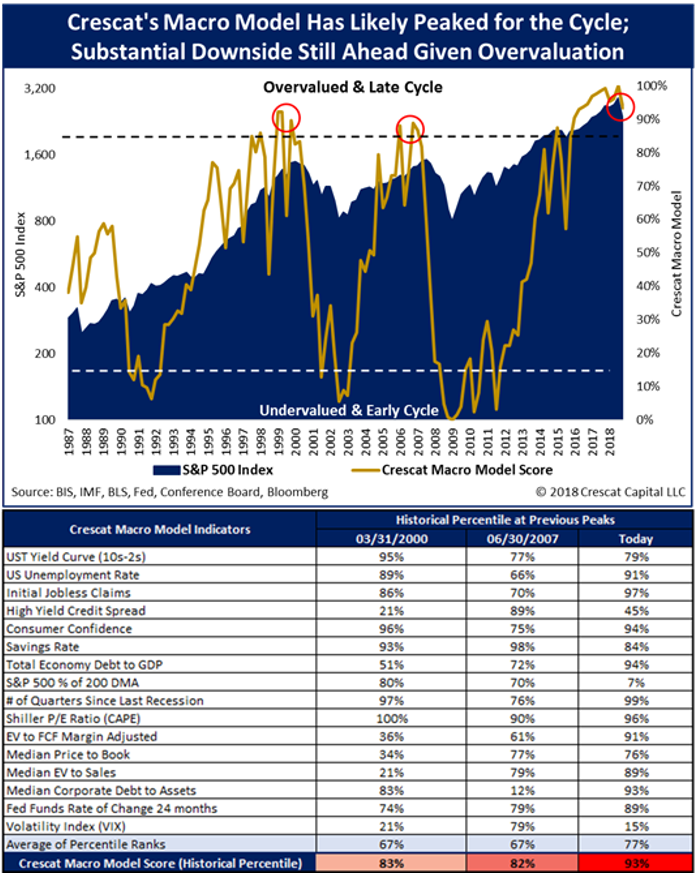
Crescat’s US Macro Model
As part of our investment process, we strongly rely on our own macro models to identify major cyclical market tops and bottoms. Our model below shows across sixteen indicators that the US stock market is highly vulnerable to a substantial further downturn that will lead the US and global economy into a cyclical recession. We showed this model to the world on January 26, right before the first market selloff of this year leading Crescat’s hedge funds to industry leading performance in February. Even though the US stock market subsequently recovered its losses and pushed to new highs though September, this model helped us to stay on course to remain net short US and global equities all year. We benefitted tremendously from the recent decline in the 4th quarter in the S&P 500. We also capitalized extremely well on international equity shorts, particularly in China, other Asian and other emerging markets, Australia, and Canada, throughout the year.
As we show in the current chart of our macro model below, even now, after the 4th quarter US stock market selloff, our overall macro model indicator is only 7 percentile points down from its highest bubble rating ever hit for US stocks, three months ago. Should we buy the recent dip? No. While there are likely to be normal bear market rallies after big down moves, and we can try to hedge against these to some degree after such moves, it should prove even more important not to get sucked into these bull traps when they happen. We need to wait until the bear market has more fully played out and a recession has become widely acknowledged before we will want to get aggressively long again. In this respect, it should pay to follow our macro model and to recognize that today our indicator is still at least 78 percentile points away from signaling a possible market bottom!
How to Avoid a Value Trap
Don’t be fooled by talking heads who tell you that US stocks are cheap because of the forward P/E multiple today. In our prior quarterly research letters, we showed eight fundamental metrics that proved that the US equity market was at record all-time high valuations. Price-to-earnings multiples are a dangerous “value trap” given record, unsustainable profit margins at the likely peak of an economic cycle. The E in the forward P/E multiple is likely to plunge as asset bubbles in the US in equities and corporate credit burst and the economy heads into recession. It is imperative to look at cyclical and margin-adjusted P/E multiples to avoid value traps near the peak of a cycle. Margin-adjusted CAPEs reached all-time highs in Q3 2018, higher than the prior all-time high in 1929 and the second-highest at the peak of the tech bubble in 2000.
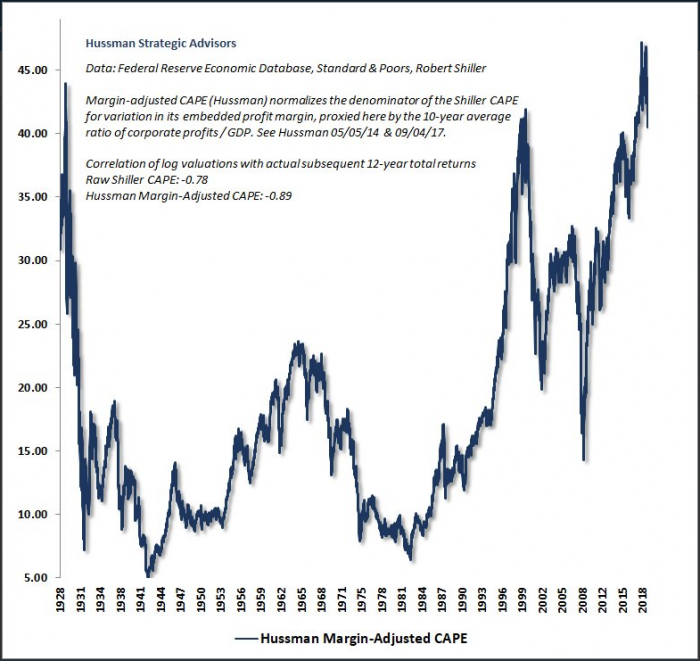
Source: Hussman Strategic Advisors
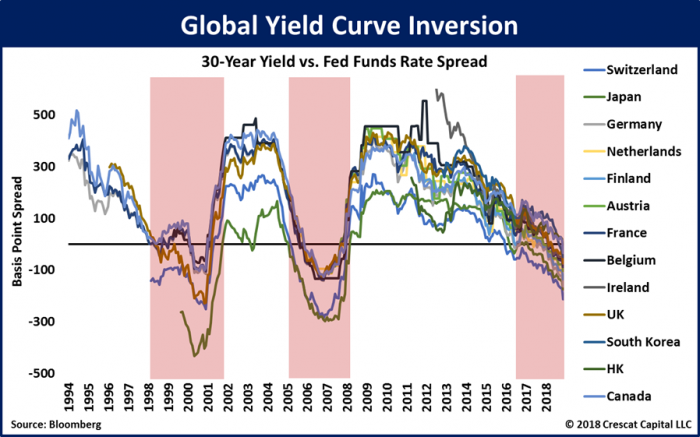
Global Yield Curve Inversion
The tightening policy by the Fed has created critical imbalances in financial markets worldwide. With Fed funds rate at 2.4% we now have 13 countries with 30-year sovereign bonds that yield less than US overnight rates. The number of economies with negative 30-year spreads relative to Fed Funds is unprecedented. The rate one can earn from holding cash in the global reserve currency competes with all other assets in the global credit markets. Historically, as we show in the chart below, this has been a concerning development in credit markets that signals recession ahead in the US and globally. The global yield curve inversion is highlighting a perceived flight to safety in global sovereign bonds despite their record low yields.
Fed vs. ECB Monetary Policy Divergence
Among the flashing warning signals from credit markets worldwide, the recent rate-hike in US overnight rates illustrates a critical divergence in monetary policies between the Fed and the ECB. The chart below shows the spread between 3-month LIBOR vs. Euribor spread, now at its widest difference ever! History shows that previous extremes followed policy reversals which importantly also coincided with the last two US stock market tops.
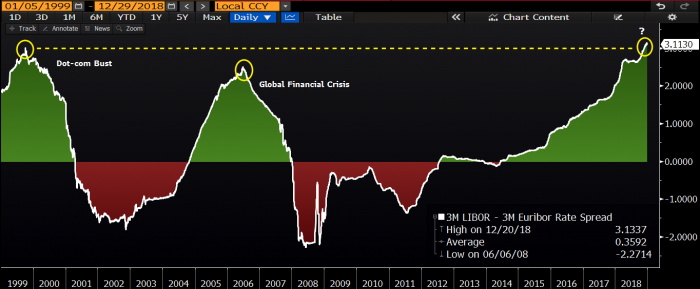
Source: Bloomberg
Oil Sending a Signal About Weakening Demand in the Global Economy
Oil prices plunged in the last quarter of 2018, a move that Crescat capitalized on in our hedge funds with short positions in individual oil exploration and production stocks identified by our model and short positions in both WTI and Brent crude oil futures in our global macro fund. The oil price decline was the worst during a Fed tightening cycle in the history of WTI futures and occurred despite the telegraphing and announcement of a new OPEC supply cut during the quarter. The oil decline is yet another one of many signs of the end of the business cycle. As we show in the chart below, it is interesting to note how all significant drops in the past also coincided with drastic Fed policy change in the following months.
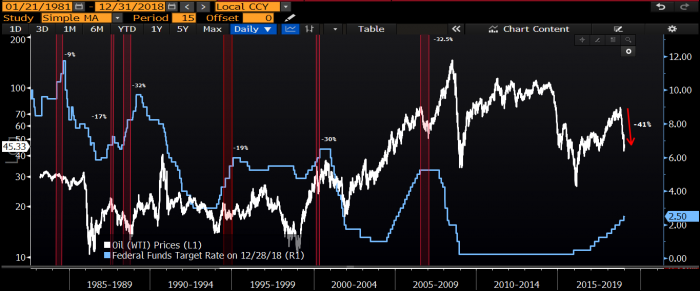
Source: Bloomberg
Chasing Utilities is Typical at Market Tops
To sum up how lazy today’s common money manager is, hedge funds and asset allocators at large have been crowding long and overweight into US utility stocks in an attempt to be “defensive”. Likewise, market pundits have been coming on financial TV regularly in the last month telling investors to do the same. Apparently, these groups are investing based on old, broken market maxims rather than doing any research and analysis. Utilities are the most over-valued sector in the US stock market today according to Crescat’s fundamental model.
Importantly, in the last two recessions, utility stocks did not perform like a defensive sector at all – the Utilities Select Sector SPDR ETF (XLU) suffered a 46% drawdown from 2007 to 2009 and a 52% one from 2000 to 2002. In our view, utility stocks could decline an even further in the coming bear market and recession given their record leverage and historic high valuations based on a combination of fundamental yield metrics such as sales to enterprise value, free cash flow to enterprise value, and book to price. By the way, utility sector aggregate free cash flow is negative in the last 4 quarters. These companies cannot even make money at the likely top of a business cycle. Ugh!
The chart below shows the 12-month correlation between the S&P 500 and utility stocks rising after reaching its most negative level since the start of the tech bust and the Global Financial Crisis. This is exactly how bear markets manifest: First, the S&P 500 gets wobbly, but utilities still rise. Then, S&P 500 crashes and utilities follow to the downside. It appears to us that utility stocks have topped out for this cycle on 12/13/2018, just as investors piled into them. They are down 6.3% since and we are happy to have taken the other side of that trade through XLU put options. We think it is still very early in coming downturn for utility stocks.
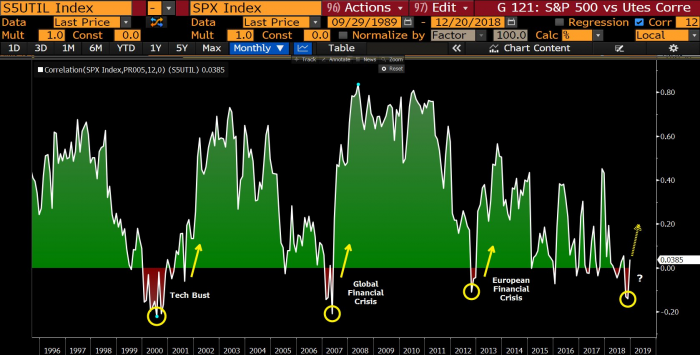
Source: Bloomberg
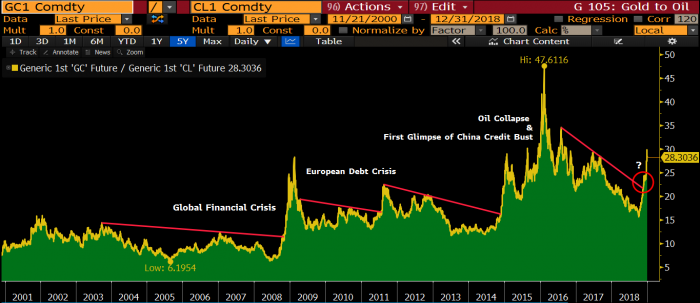
Breakout in Gold-to-Oil Ratio Sends Macro Signal
Another key macro inflection adds to our near-term bearish conviction for US equities and corporate credit. The moves between gold and oil is something we monitor closely. For us, the trend of this ratio serves as a bellwether to the stock market and the economy. Previous breakouts in gold versus oil have corresponded with stock market crashes and proved to be great times to play the ongoing widening of this spread. The recent spike above its three-year resistance line supports our views that there is further downside in equity markets globally.
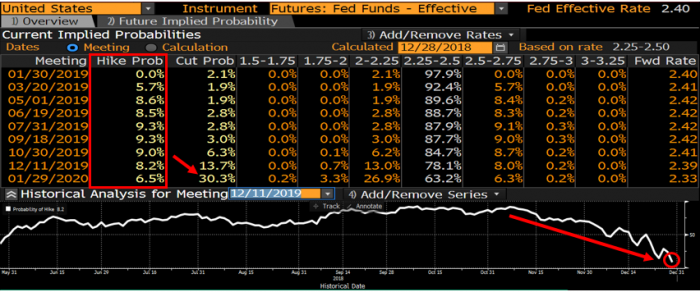
The Fed is Likely Done Hiking Interest Rates for this Cycle
The downturn in global equity and credit markets that gained traction in Q4 deserves close attention. The three big developed-market central banks are still acting like it is not a problem. Mario Draghi just announced that the European Central Bank will finally end its QE this month while the Bank of Japan has been stealthily signaling an impending taper. Meanwhile, the Fed continues to signal further tightening in 2019. The Fed Funds futures market begs to differ and has sent an important signal of an impending business cycle downturn based on plunging yields over the last two months. According to the Fed Funds futures market, the probability of any interest rate hike at all in 2019 is now less than 10%. The probably of a cut by the end of the year is now higher than the probability of a hike as shown in the table below. Investors should take note that the Fed Funds futures market is a much more reliable indicator than the Fed’s own dot plot which still shows two hikes in 2019. When it gets to meeting time, the Fed rarely likes to go against the futures market.
Source: Bloomberg
Precious Metals: A Deep Value Setup
We strongly believe based on our valuation and timing models that we are on the precipice of a US equity market meltdown that could force the Fed to act even more aggressively then post-2008. Therefore, for us, there is no better time to own precious metals than now as prices are historically cheap relative to the global fiat monetary base which is now close to $19 trillion. With the current valuation setup, a looming Fed stimulus cycle is extremely bullish for precious metals!
The chart below shows that commodities have underperformed the S&P 500 for the last decade. Given how overvalued equity markets are, we think this spread near historical low-levels justifies our long exposure to precious metals in all our strategies as the primary commodity segment that will benefit from the impending stock market and economic downturn.
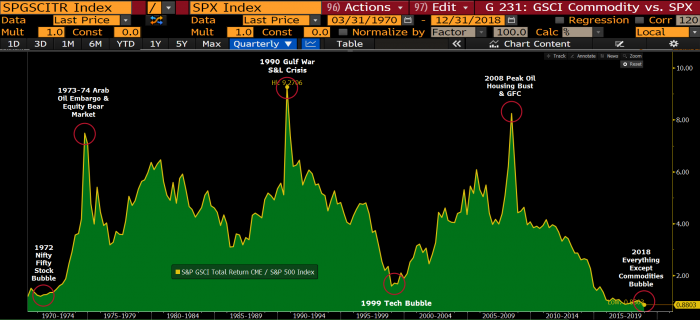
Source: Bloomberg
On the long side of our portfolios, we think precious metals commodities and mining stocks can act as true defensive havens to not only protect capital but to capitalize on the upcoming bear market. Gold and silver mining companies own valuable gold in the ground and, in many cases, are producing and generating positive free cash flow today, even at depressed gold and silver prices. Many of these stocks are deep-value plays with significant upside potential.
The ratio of the S&P 500 to the Philadelphia Stock Exchange Gold and Silver Index of mining stocks recently retested its early 2016 record extreme from which it rallied 200% in just 7 months. The chart below illustrates this double top in the S&P 500 versus gold and silver stocks. Precious metals mining companies have already begun to rise in Q4 while the S&P 500 declined. All Crescat’s strategies benefited from this nascent move up in precious metals in the quarter. We believe gold and silver are setting up for a major upward inflection.
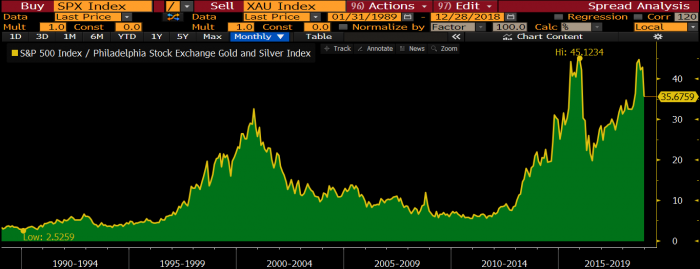
Source: Bloomberg
Corporate Credit Woes
Our research shows that non-investment-grade bonds, so-called junk, are also historically overvalued. With US corporate debt at record levels compared to GDP while the Fed is tightening, why are credit spreads near record lows? This a classic sign of a market at its peak. We researched further into the SPDR Bloomberg Barclays High Yield Bond ETF (JNK) holdings specifically, a popular ETF for high yield bonds. In aggregate terms, the ratio of net debt to free cash flow for all JNK public companies is now close to 28x. It’s hard to believe the cost of capital remains so cheap for businesses with such slim cash flow margins.
The following comparison is even more compelling for shorting junk bonds. We find it interesting how ETFs of investment grade bonds, such as the iShares iBoxx $ Investment Grade Corporate Bond ETF (LQD), have already surpassed their 2016-lows while junk bond ETFs like JNK are still well above it. We have held put options on two junk bond ETFs in our global macro hedge fund, HYG and JNK, in the fourth quarter and still do today. We see this as an incredible opportunity to capitalize from a significant credit deterioration among high-yield companies and the possibility of a re-test of the early 2016 lows.
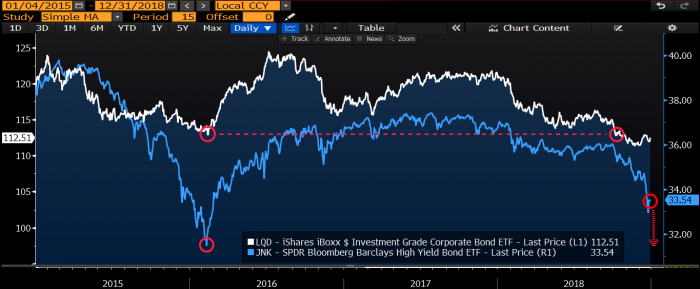
Source: Bloomberg
China: The Gray Rhino in the Room
The Chinese economy remains a large focus of ours and the recent turmoil in its equity markets confirms the legitimacy of our China credit bust thesis. Chinese stocks have now lost close to $3.6 trillion in market value, accounting for close to 25% of its GDP. In comparison with the Great Recession, by the time US markets had lost similar amounts, the economy was already in a deep recession. We think that China is already in the midst of a recession despite its positive reported real GDP numbers. We are seeing severe signs of credit tightness in China. During the second part of the year, shadow bank lending shrank at unprecedented levels. This has been a major source of capital funding for Chinese zombie companies.
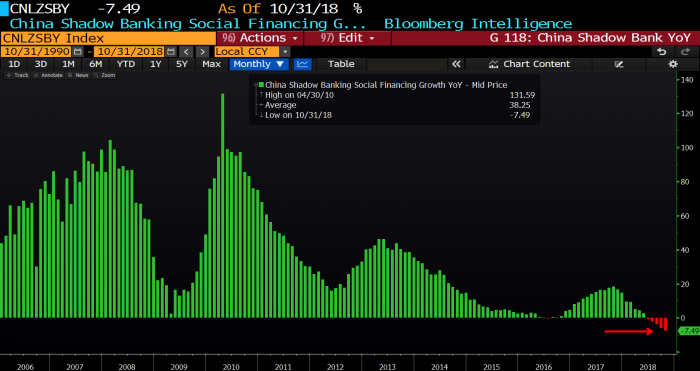
Source: Bloomberg
The last M1 growth print in China was just about 32 basis points away for its all-time lows. M2 growth is also decelerating significantly, now at its slowest pace in the history of the data. If over half of global GDP growth for the last decade relied on China, what should this be telling us about the current macro environment?
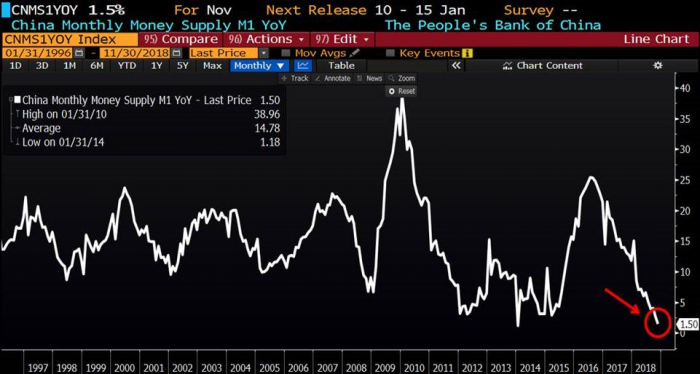
Source: Bloomberg
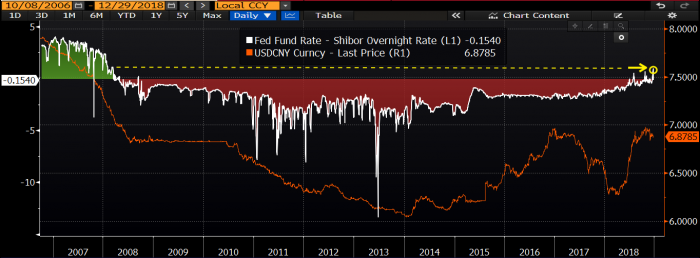
The Chinese banking system now claims to own close to $40 trillion worth of assets on its balance sheet. As we have noted multiple times before, China is sitting on a massively inflated currency and a credit bubble due to the vastly overstated value of these assets from years of not writing off non-performing loans. As US financial conditions continue to tighten, the People’s Bank of China (PBOC) is unable to act similarly, resulting in significant monetary policy divergence. For instance, see below the spread between Fed funds rate and Shibor overnight rates at its widest level since 2008. This adds further pressure on the yuan to continue devaluing.
Source: Bloomberg
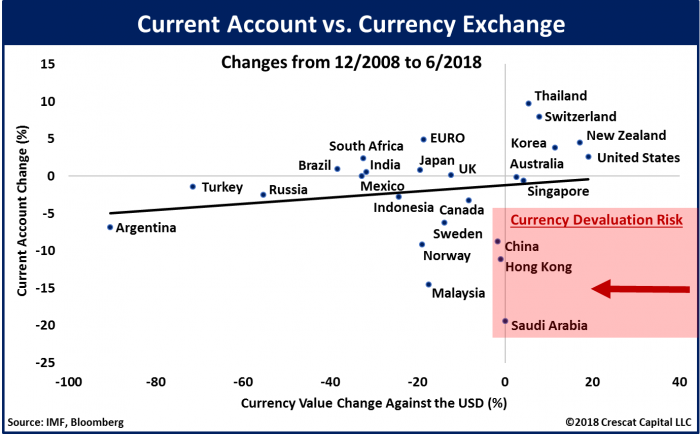
Currency pegs can be stubborn, but they ultimately fail. Based on their recent current account changes, the Chinese RMB, HKD & Saudi Riyal are some of the most overvalued currencies in the world today. Normally, big declines in current accounts cause declines in exchange rates as the chart below reinforces.
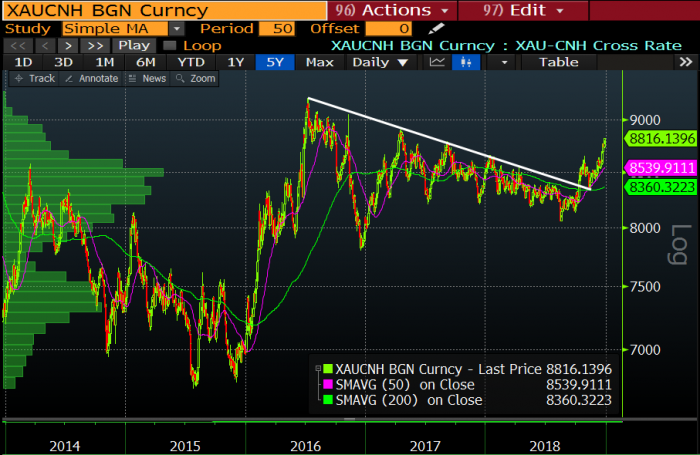
The chart below shows what we believe to be a critical breakout. The decoupling of gold vs. offshore Chinese yuan (USDCNH) is among the greatest macro trade opportunities in the world today. With Chinese equity markets in free fall, it is becoming increasingly difficult for the PBOC to prevent the yuan from devaluing against both gold and USD. Gold in yuan terms has recently re-tested its 3-year breakout level, bounced off its 200-day moving average, and formed a golden cross. Technically, this is an incredibly bullish setup both for gold and for yuan depreciation. China’s debt bomb is ticking faster, and a yuan devaluation seems unavoidable.
Source: Bloomberg
We wish all our clients and followers the happiest of holidays and a healthy and prosperous New Year!
Sincerely,
Kevin C. Smith, CFA
Chief Investment Officer
Tavi Costa
Global Macro Analyst
Sincerely,
Crescat Capital
The post Crescat Capital Up 40% In 2018 On Everything Bubble Short appeared first on ValueWalk.
Sign up for ValueWalk’s free newsletter here.


