

By Jacob Wolinsky. Originally published at ValueWalk.
Coronavirus Causes Largest Drop in Americans’ Financial Satisfaction in Over A Decade: AICPA Personal Financial Satisfaction PFSi Index
Q1 2020 hedge fund letters, conferences and more
- The Q1 2020 PFSi dropped 20 percent, driven primarily by a steep decline in the market
- PFS 750 Market index loses all gains from past 3 years, after hitting a record high last quarter,
- CPAs provide financial planning tips to help Americans navigate difficult time
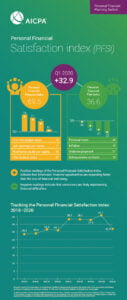
NEW YORK (April 23, 2020) – As the COVID-19 pandemic has strained the U.S. economy and put millions out of work, Americans have experienced the biggest drop in their personal financial satisfaction in more than a decade. The AICPA’s Q1 2020 Personal Financial Satisfaction index (PFSi) measures 32.9, a 20 percent (8.29 point) decrease from the previous quarter. This is the largest quarterly drop the PFSi has experienced since the Great Recession (Q4 2009).
Stock Market Decline Drives Drop
The most notable factor driving the quarter-over-quarter PFSi decline was the PFS 750 Market index, an AICPA proprietary stock index comprised of the 750 largest companies trading on the US Market. In comparison to its Q4 2019 record high, the Market index is down 21 percent (20.9 points), wiping out all its gains from the past three years.
The next largest contributor to the PFSi decline is the Inflation index which is up 33.8 percent (10.7 points) from the previous quarter. An increase in inflation adds to financial pain, driving down the PFSi overall. Inflation is the most volatile factor contributing to the PFSi and with absolute levels so low, small changes result in large percent gains. This factor relies on data released in late March that reflects the Federal Reserve’s February level before rates were cut to near zero.
“We’re hearing from CPA financial planners across the country that now more than ever their clients are relying on their guidance to navigate these extraordinary times,” said Andrea Millar, CPA/PFS, Association of International Certified Professional Accountants Director of Financial Planning. “From giving clients peace of mind that principles of financial planning haven’t changed, to proactive planning with tax-efficient portfolio moves, and small business loans, CPAs have been working tirelessly to secure their clients financial future and to help them realize their life goals.”
Unemployment & Income Disruptions
The PFSi is a quarterly economic gauge that measures the personal financial standing of a typical American. It serves as an indicator. The Q1 calculation utilizes economic data that was largely measured before the COVID-19 pandemic began to impact the U.S. economy. The 22 million Americans who have filed for unemployment benefits since mid-March and the increasing number of Americans who are struggling to come up with cash to pay for everyday items, rents, and mortgages will be reflected in the Q2 PFSi.
To help Americans navigate the COVID-19 financial storm, members of the AICPA Personal Financial Planning section share the following tips:
- Tax Deadline Delays Mean More Time to Make 2019 Retirement Contributions
“The COVID-19 pandemic is first and foremost a public health crisis, and people’s safety and wellbeing should be their primary concern. If you are able to pay your essential bills, and you have enough savings to sustain you through a potential job loss, consider contributing to your retirement. The extension of the federal tax filing and payment deadline to July 15, 2020 also extends the amount of time you have to make contributions to IRAs and HSAs for 2019.” -Mark Astrinos, CPA/PFS, member of the AICPA PFS Credential Committee.
- Do Your Best to Hold Steady
“In times of high stress, it can be easy to make money moves to help you today that you end up regretting down the road. When the market experiences a significant pullback, it is important to resist the temptation to make a short-term move that could impact the long-term goals of your financial plan. Instead, remain focused and stay the course with a financial plan that incorporates a risk tolerance you are comfortable with and a time horizon specific to your personal financial goals.” -Dave Stolz, CPA/PFS chair of the AICPA PFS Credential Committee.
- Your Portfolio May Be in The Red, But Your Tax Planning Can Be in The Black
“Coronavirus-fueled investment losses can help cut your taxes if you know how to work those losses. Review your investment portfolio to see what potential investments you can sell now to lock in the tax benefits. Even better, if you’d like to maintain exposure to that asset class, you can buy a similar investment and eventually buy back into that original investment after 30 days. Be sure to wait at least 30 days in order to avoid ‘wash sale’ rules which are in place to prevent taxpayers from deducting loses from trading substantially similar securities within 30 days of each other. This strategy is known as tax loss harvesting and can help to lower your potential tax hit.” – Michael Landsberg, CPA/PFS, member of the AICPA PFP Executive Committee
- Perfect Opportunity for Wealth Transfer Strategies
“When making gifts to family members, either directly or into a trust, the goal is for the asset to appreciate and remove the appreciation from the donor’s estate. When transferring wealth, the market value of the property is considered the value of the gift. From a tax planning perspective, you want the value of a gift to be low when it is given. A depressed market provides lower gift value. The value of the gift is offset by the gift and estate tax exemption or it is subject to tax if the exemption is exhausted. As part of the Tax Cuts & Jobs Act, the exemption for gifts is temporarily doubled to $11.58m which makes now an even better time to consider this strategy.”-Lisa Featherngill, CPA/PFS member of the AICPA PFP Executive Committee
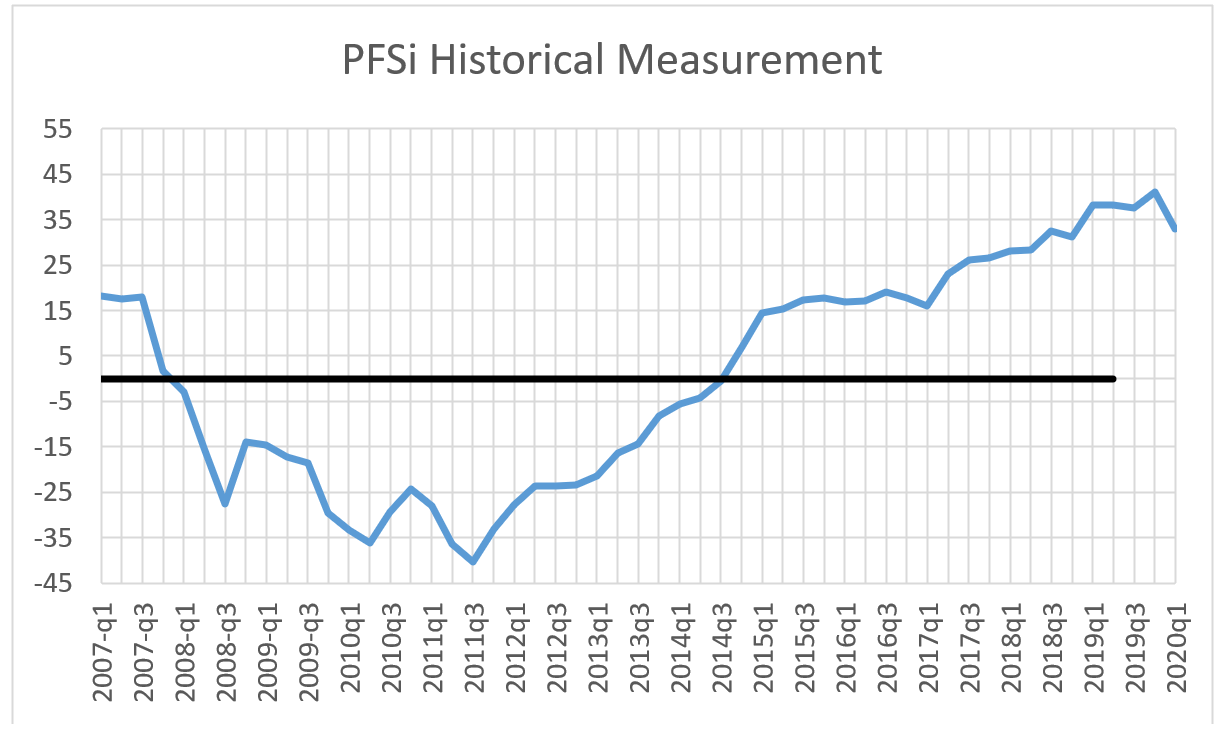
What Is the PFSi & How Is It Calculated?
The PFSi is a quarterly economic gauge that measures the personal financial standing of a typical American. The index is calculated as the Personal Financial Pleasure Index (Pleasure Index) minus the Personal Financial Pain Index (Pain Index). These sub-indexes are each composed of four equally weighted proprietary and public economic factors which measure the growth of assets and opportunities in the case of the Pleasure Index, and the erosion of assets and opportunities in the case of the Pain Index. A positive reading of the PFSi indicates that the average American should be feeling more financial pleasure than pain and thus have an overall positive sense of financial satisfaction. Additional information on the PFSi can be found at: www.aicpa.org/PFSi.

Personal Financial Satisfaction Index (PFSi) Defined
The Personal Financial Satisfaction Index (PFSi) is the result of two component sub-indexes. It is calculated as the difference between the Personal Financial Pleasure Index and the Personal Financial Pain Index. These are in turn composed of four equally weighted factors, each of which measure the growth of assets and opportunities, in the case of the Pleasure Index, and the erosion of assets and opportunities, in the case of the Pain Index.
Methodology
To construct the indices each component was first normalized by its own standard deviation prior to July 2013. The factors were then individually modified to an average value of 50 over the period up to July 2013. The financial pleasure index and the financial pain index each equally weight the individual component factors.
First Quarter 2020 PFSi Summary
The PFSi measured 32.9 in the First Quarter of 2020. It reflects an 8.2 point (20.0%) decline from the prior quarter, and a 5.4 point (14.2%) drop from the year ago level. Almost all the gains of 2019 ( PFSi of 2018Q4 was 31.1) have been erased.
The dramatic 8.2 point (20%) decline of the PFSi from the record breaking Q4 2019 level was driven by the 20 point (21%) decline in the PFS 750 Market Index. The second most important driver was a 10.7 point (33.8%) increase in inflation.
Compared with the year ago level, the 5.4 point (14.2%) decline was due to an 11.2 point (12.5%) drop in the PFS 750 Market Index, an 11.3 point (36.2%) increase in inflation and a 7.4 point (8.8%) drop in job openings, offset by a 5.2 point (17.3%) decline in loan delinquencies.
First Quarter 2020 Personal Financial Pleasure Index Top-Line Summary
The Personal Financial Pleasure Index, at 69.5, is below every reading since the 67.95 level as of 2017 Q3. Compared with that level, the big decline was the PFS 750 Market Index. It dropped 5.6 points (6.7%). Offsetting that drop, both home equity and job openings are still more than 6 points ahead of the 2017 Q3 levels, retaining gains of 8.8% and 10%.
Compared with the record Q4 2019 results, the Pleasure Index dropped 5.4 points (7.2% ). This was primarily driven by the 20.9 point (21.0%) decline in the PFS 750 Market Index, followed by the 4.22 point (5.2%) drop in job openings, offset by the 3.7 point (7.7%) gain in the CPA Outlook Index.
Compared with the year ago levels, the index dropped 4.3 points (5.8%). The big factors were an 11.2 point (12.5%) decline in the PFA 750 Market Index and a 7.4 point (8.8%) drop in job openings.
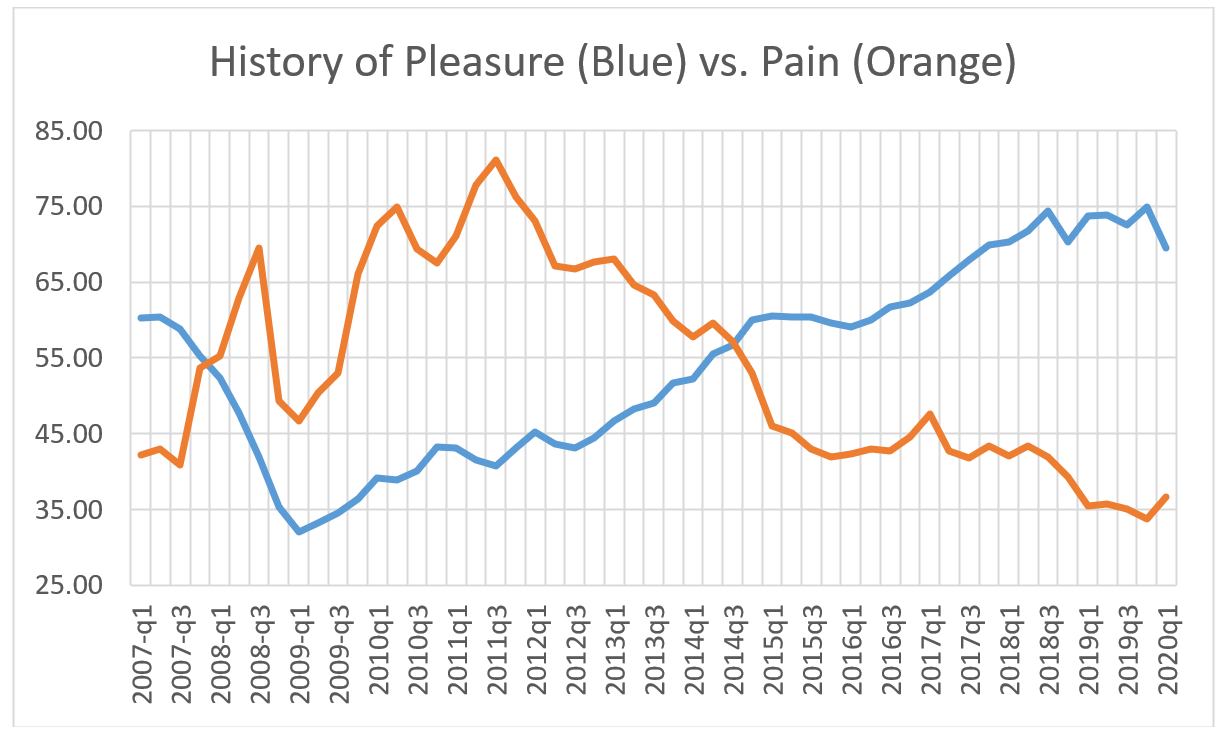
First Quarter 2020 Personal Financial Pleasure Index Detailed Summary8
PFSi Market 750 Market Index: This factor has made the largest contribution to the Pleasure Index from 2009 q4 to the present, with the exception of only 2 quarters (Q4 2018 and Q3 2015). This is still true with the latest level of 78, down 11.2 points (12.5%) from the year ago figure. It also fell 20.9 points (21%) from the record Q4 level. The Market 750 Index’x standing as the largest contributor to the Pleasure Index is now less dominant; job openings stand at 77 versus its 78 reading.
By far the strongest industry, both over the last 3 months and the last 12 months, has been information technology, although it has declined about 15% in the quarter, while eking out a 3% gain versus a year ago. Some of the strongest performances have been by Nvidia, Citrix Systems, Akami, Microsoft and Apple. Far and away the weakest sector has been energy
Real Home Equity per Capita: This factor’s current value, which is based on data issued for December, is 2.4% above the prior year value and virtually flat (down 0.5%) with the previous quarter level. It is only 5.6% below its early 2006 all-time high.
The changes in value have been due to increases in the market value of real estate, which for the most recent reading came in about 3.8% per annum. This has been sufficient to exceed increases in mortgages outstanding, which have been advancing at about 2.8% per annum.
According to the Case-Shiller 20 city composite
- As of December, national home prices were 2.9% higher than the year-ago level.
- The strongest gains were in Phoenix, Charlotte and Tampa.
- According to Case-Shiller, national home prices are 59% above the trough reached in February 2012, and 15% above their pre-financial crisis peak. Results for 2019 were broad-based, with gains in every city in the 20-City Composite.
Job Openings per Capita: The current reading is 8.8% below the prior year reading, and 5.2% down from the previous quarter level. The First Quarter index is based on January data.
Total nonfarm employment was over 152 million in January, and 2.1 million new jobs were added in 12 months. There were almost 7 million job openings, but only 5.9 million unemployed in January; openings thus exceed job seekers. Of course, the number of unemployed dramatically increased in the second half of March. The most recent 2 weekly reports of new claims for unemployment came to just over 9.9 million.
In comparison to year ago levels, the job openings level decreased for total private (-557,000 or 7.4%) but increased 43,000 (6.0%) for government. The most substantial declines in job openings were in accommodation and food service (271,000 or 26.6%), professional and business services (134,000 or 9.7% and wholesale trade (94,000 or 33.7%). There were more modest employment gains in arts, entertainment and recreation (38,000 or 35.9%) and other services (94,000 or 54%).
Regionally, job openings fell in all areas, most drastically in the Midwest (273,000 or 15.4%). Only the Northeast had a minor loss of 6,000 openings (0.5%).
AICPA CPA Outlook Index: The current reading is flat with the prior year and 7.7% above the previous quarter. The survey was conducted from February 4 to 26.
- The recent low point for this index occurred in Q1 2016. The all time high of the series was in early 2000. The index is 28% lower than its early 2000 peak.
- Compared with the prior quarter index, all components show advances, strongly led by US Economic Optimism, followed by Organization Optimism, and Revenue, and then Expansion Plans.
- Compared with the year ago index, all the changes were small. The US Economic Outlook was the strongest gainer. Profits and Training & Development were the strongest downticks..
- The strongest factors in the level of the Q2 2020 index (as opposed to changes) are by IT Spending and Revenue. These have been the strongest factors since Q3 2018.
First Quarter 2020 Personal Financial Pain Index Top-Line Summary
Pain index at 36.6 is 1.2 points (3.3%) above the prior year and 2.9 points (7.8%) over the preceding quarter.
The year ago comparison is due to an 11.3 point (36.2%) increase in inflation, offset by decreases in all other factors, led by loan delinquencies (down 5.2 points, 17.3%), followed by underemployment (1.1 point, 3.3% decrease) and then taxes (0.2 point or 0.5% decline).
The larger increase compared with the Q4 2019 reading was driven by increases in 3 of the 4 pain factors. However, a 10.7 points (33.8%) increase in inflation accounts for most of the increase. Instead of declining, underemployment registered a 1.1 point (3.6%) gain, and taxes climbed 0.7 points (1.5%). Delinquencies on loans continued its down trend, but only losing 1.1 points (4.2%), continuing a trend of smaller decreases each period.
First Quarter 2020 Personal Financial Pain Index Detailed Summary
Delinquencies on Loans: This factor’s current level is 17.3% lower than in the prior year, and 4.2% below the previous quarter’s level. Most of the annual decline was due to improvements in mortgage delinquencies. Mortgage delinquencies continued to decline at about the same pace as they have for the last year. However, overall bank loan delinquencies increased slightly, reducing the decrease versus the prior quarter level.
The peak delinquency rate for mortgages was 11.26% in the spring of 2010, and the peak for all loans was 7.5% at the end of 2009. The current reading of 2.35% delinquencies on mortgages is still above the 2.1% that was typical between 1994 through 2003.
Underemployment: This factor, registering 30.7, is 3.3% lower than the prior year level but 3.6% above the last quarter level. In comparison, its peak value was 84.3 corresponding to 17.1% in the first quarter of 2009 (versus the current 7%). It is now 15.4% below its average value in the two years before the great recession.
Like most economic measures, unemployment is worse in some regions than in others. In February. These points rely on the general unemployment rate, which is available by states, rather than the broader underemployment measurement used in the PFSi. The states with the lowest unemployment rates were North Dakota, Vermont, Colorado, South Carolina, and Utah. The rates in 15 states Alabama (2.7%), Alaska (5.8%), Arkansas (3.5%), California (3.9%), Colorado (2.5%), Florida (2.8%), Georgia (3.1%), Idaho (2.7%), Illinois (3.4%), Maryland (3.3%), Nevada (3.6%), New York (3.7%), North Dakota (2.2%), Oregon (3.3%) and Washington (3.8%) were at all-time lows. The national average unemployment rate was 3.5%. Twenty-six states, led by North Dakota at 2.2% and Vermont at 2.4%, registered unemployment rates lower than that. Another 5 states came in at the average and 20 (including the District of Columbia) were above it. Nationally, the unemployment rate fell by 0.3 percentage points from the year ago level. Seventeen states, led by Illinois, Oregon and South Carolina (each down 0.9 percentage points) had larger reductions. Five states were at the average. Twenty-nine states did less well, including 5 states with no change in rate and 13 states, capped off by Louisiana and Pennsylvania which increased 0.6 percentage points. Unemployment was highest in Alaska, followed by Mississippi. It was lowest in North Dakota, followed by Vermont. Unemployment was most severe in farming, fishing and forestry and lowest in community and social service.
Inflation: Our blended inflation measure is 1.8% for the First Quarter, versus 1.3% both a year ago and last quarter. Please note that the Federal Reserve’s target for core inflation (which eliminates the contributions of food and oil) is 2%; core inflation is currently at 2.4%. In terms of the PFSi inflation index, the current index value is 42, up 36.4% from the year ago level and 33.8% from the Q4 2019 level (different percent changes due to differences in the year ago and quarter ago levels that disappear in rounding).
Inflation is the most volatile factor contributing to the PFSi, and with absolute levels so low, small changes result in large percent gains. The Q1 pain index relies on the February level.
Personal Taxes: The personal taxes index decreased 0.2 points (0.5%) from the year-ago level but increased 0.7 points (1.5%) from the prior quarter.
Personal tax rates plunged more than 200 basis points to under 9.5% in mid-2009, and they have been increasing unevenly since then. The current level is 11.7 %. Going back as far as 1994, the highest levels for personal taxes were 14% to 14.5% from late 1999 to mid-2001.
About the American Institute of CPAs
The American Institute of CPAs (AICPA) is the world’s largest member association representing the CPA profession, with more than 429,000 members in the United States and worldwide, and a history of serving the public interest since 1887. AICPA members represent many areas of practice, including business and industry, public practice, government, education and consulting. The AICPA sets ethical standards for its members and U.S. auditing standards for private companies, nonprofit organizations, federal, state and local governments. It develops and grades the Uniform CPA Examination, offers specialized credentials, builds the pipeline of future talent and drives professional competency development to advance the vitality, relevance and quality of the profession.
The post Americans have experienced the biggest drop in their personal financial satisfaction in more than a decade appeared first on ValueWalk.
Sign up for ValueWalk’s free newsletter here.


