

By Jordan Waldrep. Originally published at ValueWalk.

The practice of ESG evaluation continues to evolve, but one of the early metrics engrained in the social consciousness – greenhouse gas (“GHG”) emissions– remains a gold-plated standard for evaluating companies’ impact on the global environment. As regulations generally continue to tighten across the world and facing the possibility of consumer backlash, more companies have begun to voluntarily report on GHG levels.
Q1 2020 hedge fund letters, conferences and more
As more data becomes available, it affords us the ability to take a look at how GHG levels and stock performance interact. In this article, we will take a look at how U.S. firms’ carbon footprint and stock price performance over the five years ended 12/31/2019. Just to be clear, the goal of this article is to point out observations, not make predictions. With that said, we believe there are multiple themes, highlighted later below, that will make reducing a company’s overall carbon footprint not only more policy-compliant but potentially more economically attractive.
Methodology Background
We started with a universe of all S&P 500 companies, narrowing down to those who reported their carbon emission levels for 2018. Reporting generally takes place annually as part of companies’ larger annual report filing, so the 2018 end date allowed for the broadest inclusion of recent filings. This filtering typically left us with roughly 50% of the index constituents.
Next, companies were ranked by their carbon intensity levels. Carbon intensity is measured by dividing a company’s GHG levels (in tons) by their revenues (in U.S. dollars). Another way to think about this is how much greenhouse gas does a company generate for every dollar of sales. Once companies were ranked, they were then grouped into quintiles based on highest intensity emitters to lowest intensity emitters. Finally, cumulative performance was calculated for each stock for the five-year period 12/31/2014-12/31/2019. That performance was rolled up to create an average 5-year cumulative performance figure for each quintile.
Results
Looking at the table below, you can see that lower-emitting companies outperformed higher-emitting companies for the five-year period being explored, with performance improvement at each subsequent quintile level.
Cumulative Returns by Emission-Level Quintiles1
5-Year Period Ended December 31, 2019
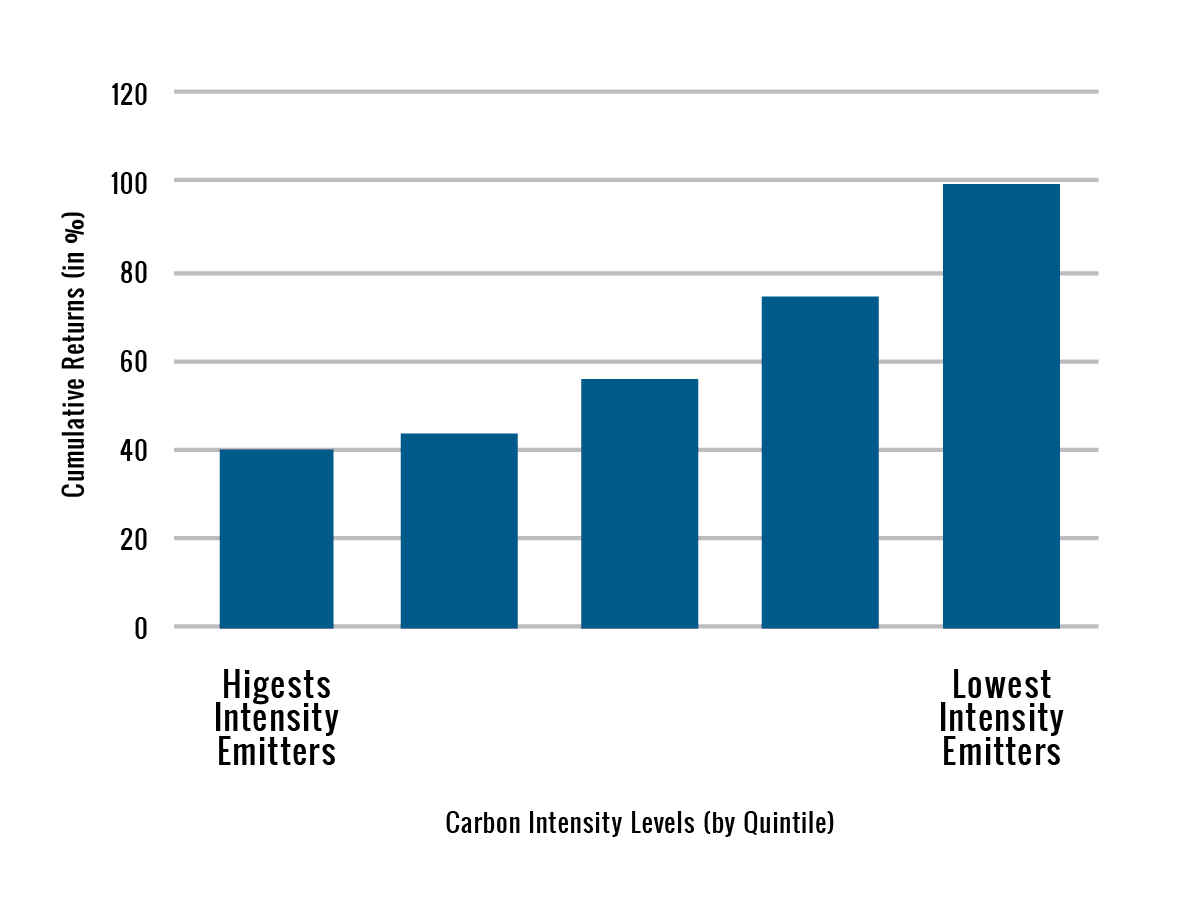
1. Source: Bloomberg, as of 3/8/2020. Data for five-year period ending 12/31/2019. The underlying universe is comprised of all S&P 500 companies that reported carbon emissions for 2018 (251 companies reporting). Reporting companies were grouped by carbon emissions intensity levels from highest emission intensity companies to lowest emission intensity companies based on 2018 reporting levels. Past performance is not an indicator of future results. Returns are total returns and represent investment of dividends.
Next, we regrouped the companies by their respective Global Industry Classification Standard (GICS) sectors to see if there was any discovery to be made related to sector performance differences between lower-emitting (“cleaner”) and higher-emitting (“dirtier”) sectors. We ranked each sector by its median GHG emission intensity and then measured the aggregated performance of reporting companies for each sector over the same five-year time period.
Looking at the chart below, you see that, generally, the cleaner sectors tended to have better performance.
Cumulative Sector Returns – Ranked by Sector Median Emission Level2
5-Year Period Ended December 31, 2019
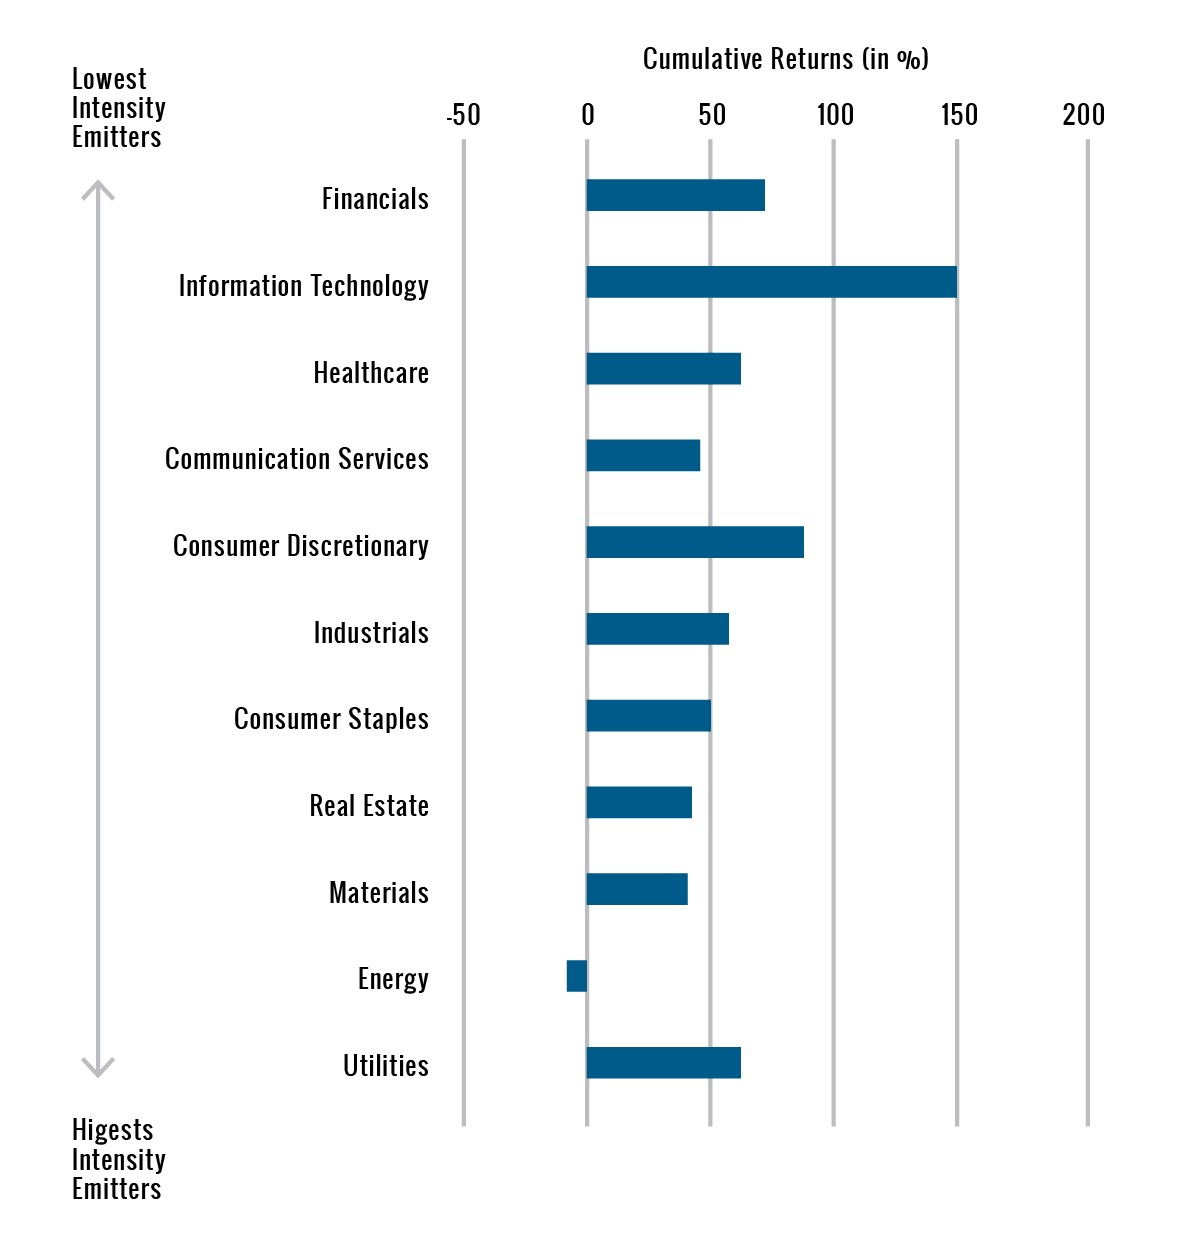
2. Source: Bloomberg, as of 3/8/2020. Data for five-year period ending 12/31/2019. The underlying universe is comprised of all S&P 500 companies that reported carbon emissions for 2018 (251 companies reporting), grouped into their respective sectors. Reporting companies were grouped by carbon emissions intensity levels from highest emission intensity companies to lowest emission intensity companies based on 2018 reporting levels. Past performance is not an indicator of future results. Returns are total returns and represent investment of dividends.
Takeaways
Again, the overarching caveat here is that we’re highlighting observations and not making predictions on a go-forward basis. We also acknowledge that any examination along these lines runs the risk of spurious correlation conclusions being drawn and assumptions extended into other areas. We’ll note, for example, that if you drill down by trying to group and measure performance for companies intra-sector, there is less consistency in performance results. From what we can see, this is due to the fact that there often isn’t enough difference in carbon-intensity levels for companies within the same sector for the differences to matter much at this point. Also, other secular change factors, independent of companies’ or sectors’ carbon footprints, will inevitably create “outlier” performance periods over time.
With that being said, we think that there has been, and will continue to be, a growing impact on corporate performance due to companies’ carbon footprints. It’s our belief that in addition to reducing regulatory risks and improved consumer goodwill, a focus on reducing a company’s emission intensity can also help limit stranded asset3 and asset revaluation risks. We believe these elements should have an influence on the operating efficiency of a company, and result in a direct impact to a company’s bottom-line earnings. If this occurs, we would expect it to start working its way into stock price estimates that result from fundamental research.
3. Stranded assets have seen a decline in their expected value (due to changes in technology, innovation, or new areas of economic growth) that leads to a write-down or devaluation of their worth.
Important Information
The content herein includes the views, opinions and analysis of the investment manager as of the date of publication. These views and information are subject to change without notice, and are not meant to be a complete analysis of any market, industry, country, or company.
Certain information herein has been obtained from third party sources and, although believed to be reliable, has not been independently verified and its accuracy or completeness cannot be guaranteed. No representation is made with respect to the accuracy, completeness or timeliness of this document. TrueMark Investments accepts no liability for any losses arising from use of this information and reliance upon the comments, opinions and analysis in the materials is at the sole discretion of the reader.
All investments involve risk including possible loss of principal.
Before investing, carefully consider the True- Shares ETFs investment objectives, risks, charges and expenses. Specific information about the True-Shares is contained in the prospectus and a summary prospectus, copies of which may be obtained by visiting true-shares.com. Read the prospectus carefully before you invest. Foreside Fund Services, LLC, distributor.
About the Author
Jordan Waldrep, CFA, is currently Chief Investment Officer and portfolio manager at TrueMark Investments LLC. Mr. Waldrep has been in the investment management industry for over 16 years, in both portfolio management and research roles. He received his undergraduate degree from Texas A&M university in Biology and History and his MBA in Finance from the University of Texas at Austin. Mr. Waldrep is a CFA® charterholder.
The post Carbon Footprints’ Keep Stepping on Equity Performance appeared first on .
Sign up for ValueWalk’s free newsletter here.


