

By Alpha Architect. Originally published at ValueWalk.

Among stock investors, a common strategy/belief held is Value investing — buying stocks that are relative cheaper on price/fundamental ratios.
Q2 2020 hedge fund letters, conferences and more
The idea behind why value investing works is that Value stocks are either (1) riskier and/or (2) have been mispriced by the market. In theory, these elements of risk/mispricing lead to expected above-market returns.
However, this strategy has failed over the past couple of years, causing many to doubt/question what is going on with the strategy. Given the recent underperformance, there have been a lot of articles written about the “Death of Value Investing.”
Some of these articles that examine this question, “Is Value Dead?”, have examined the performance of two well-known indices, the Russell 1000 Value index, and the Russell 1000 Growth index. These are widely referenced in the industry, are market-cap-weighted, and have returns going back to 1979.
Since Value is supposed to beat Growth over the long-run, how have the indices performed?
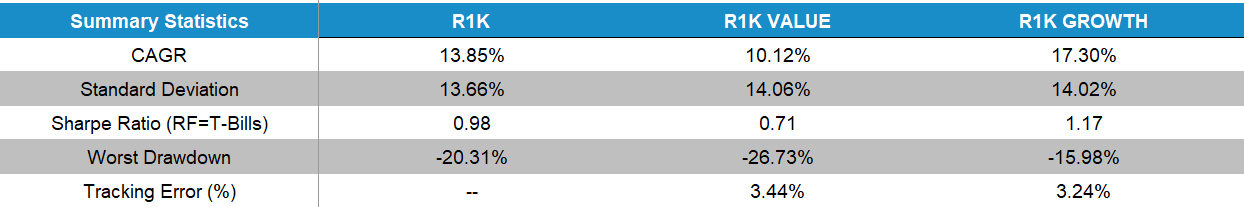
Below is the performance from 1/1/1979 through 7/31/2020 of the Russell 1000 index, the Russell 1000 Growth index, and the Russell 1000 Value index. 1
The results are hypothetical results and are NOT an indicator of future results and do NOT represent returns that any investor actually attained. Indexes are unmanaged, do not reflect management or trading fees, and one cannot invest directly in an index.
What immediately jumps out is that Value has lost to Growth over the entire time sample!
As a Value investor, a disappointment to say the least.
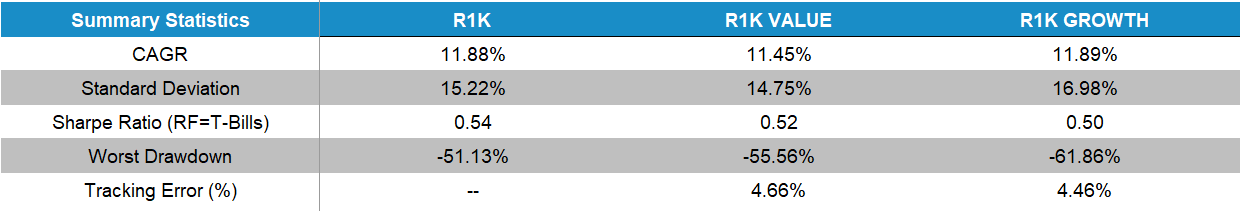
Digging deeper, let’s look at the performance over the past 10 years (8/1/2010-7/31/2020):
The results are hypothetical results and are NOT an indicator of future results and do NOT represent returns that any investor actually attained. Indexes are unmanaged, do not reflect management or trading fees, and one cannot invest directly in an index.
Viewed another way, since the human mind has issues with compounding:
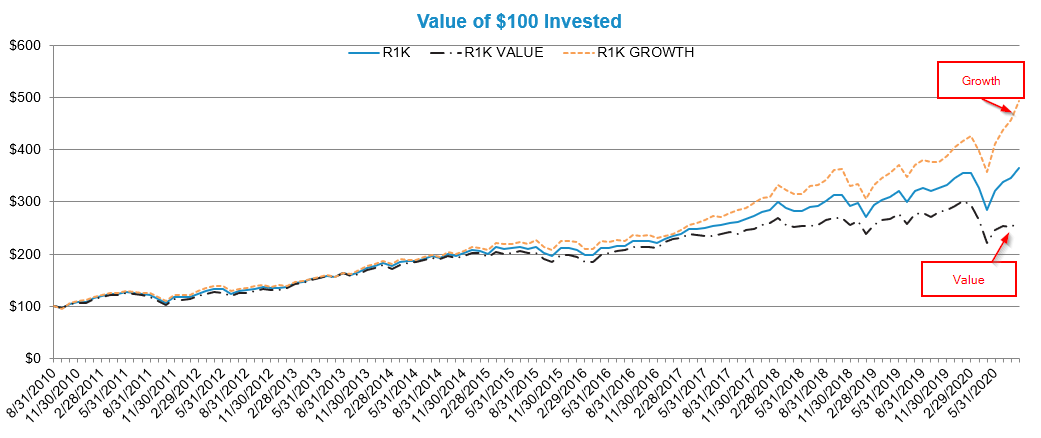
The results are hypothetical results and are NOT an indicator of future results and do NOT represent returns that any investor actually attained. Indexes are unmanaged, do not reflect management or trading fees, and one cannot invest directly in an index.
And last, for the real pain, over the past 1, 3, and 5 years (through 7/31/2020):
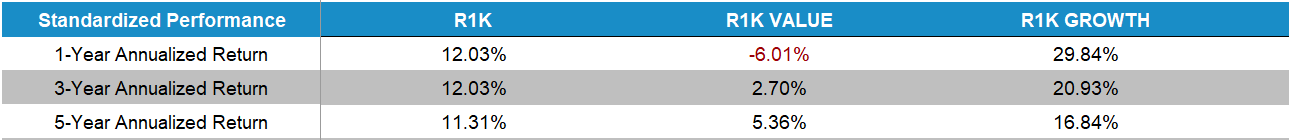
The results are hypothetical results and are NOT an indicator of future results and do NOT represent returns that any investor actually attained. Indexes are unmanaged, do not reflect management or trading fees, and one cannot invest directly in an index.Thus, in some people’s minds, Value investing is dead.
However, let’s take a step back for a moment.
What is Value investing?
It is simply trying to buy stocks that are cheaper when compared to other stocks.
But what does it mean for a stock to be cheap?
Let us look at a simple example. Pretend that there are only 4 stocks in the universe in which we can invest. We are going to simply look at the firms’ earnings each year, and compare that to the price one would pay if you bought the entire company’s equity (i.e. the firm’s market capitalization). This is the simple P/E ratio.
4 Stock Example:
- Stock 1: Earnings = $100, Market Cap = $1000, Price/Earnings = 10
- Stock 2: Earnings = $50, Market Cap = $1000, Price/Earnings = 20
- Stock 3: Earnings = $25, Market Cap = $1000, Price/Earnings = 40
- Stock 4: Earnings = $10, Market Cap = $1000, Price/Earnings = 100
So in my simple 4-stock example, Stocks 1 and 2 trade at a lower multiple of earnings relative to Stocks 3 and 4. A systematic Value investor, who only uses the P/E multiple, would prefer Stocks 1 and 2 compared to Stocks 3 and 4.
As a shopping example, Stocks 1 and 2 are “on-sale” compared to stocks 3 and 4. All 4 firms have the same market cap, but firms 1 and 2 make more $ (earnings) each year. So they “value” or “cheap” stocks.
Of course, my example above is very simplified and we are only looking at one point-in-time number–past year’s earnings.
Firms 3 and 4 may be growing at a faster rate, and we can create more advanced models to try to figure out the “best” investment. However, if it were the case that experts can create better models, then active managers wouldn’t lose to the market ~ 80% of the time over 5 years.
Academics have studied how Value stocks perform relative to Growth stocks. In general, they use the book value of assets divided by the market cap of the firm, as this was the measure used in the seminal 1992/1993 Fama and French papers.
What did they find?
They found that Value stocks outperformed Growth stocks. In the original paper, they highlight that this is most likely compensation for taking on additional risk (to underscore that this is not a free lunch). 2
Of course, one can use other measures to identify cheap stocks, besides P/E and B/M. We examined different methods here. However, the big picture takeaway was the following — Value beat Growth.
So back to our Russell 1000 examples–why then, does the Russell 1000 indices have Growth beating Value?
Part of this is the construction process that they use. Here are the three variables that they use.
- Book-to-Market
- Medium-term forecast earnings growth rate based on I/B/E/S two-year forecasts
- Sales-per-share growth rate based on five-year historical sales
Without making any judgments on whether or not this is a good/bad process, one should note that the methodology is definitely different than the simple example above, which was simply splitting firms on the P/E multiple (or other value measures, like B/M or EBIT/TEV).
So what would happen if we went back and tested splitting the 1,000 largest firms 3 on a simple P/E multiple?
To answer that, I dug into the data. I annually rebalanced the portfolio on 6/30, using the firm’s market cap to identify the 1,000 largest firms. Firms’ earnings’ values were brought in as of 6/30 of each year, while only examining data available as of 3/31 each year. 4 This was done to eliminate a “look-ahead” bias.
All portfolios shown in the main text use market-cap weights, or value-weighting in the academic parlance.
First, I wanted to check that the 1,000 largest firms reasonably matched the returns of the Russell 1,000 index. The results below show that the performance from 1/1/1979-12/31/2019 was very close, and the two returns are very highly correlated, at 99.83%.
1/1/1979 – 12/31/2019:
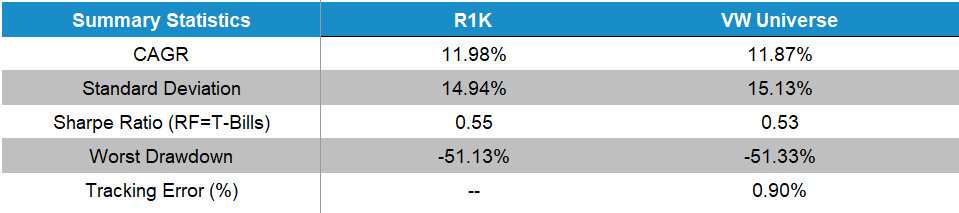
The results are hypothetical results and are NOT an indicator of future results and do NOT represent returns that any investor actually attained. Indexes are unmanaged, do not reflect management or trading fees, and one cannot invest directly in an index.
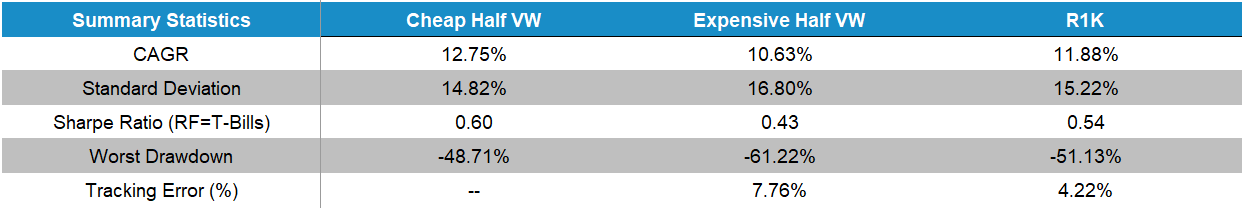
Next, I then split the universe on 1 variable as of 6/30, the Price/Earnings (P/E) multiple. Firms trading at higher multiples of earnings are deemed to be “Growth” firms, and firms trading at lower multiples of earnings are deemed to be “Value” firms. The results below are when I market-cap weight the two groups.
1/1/1979 – 12/31/2019:
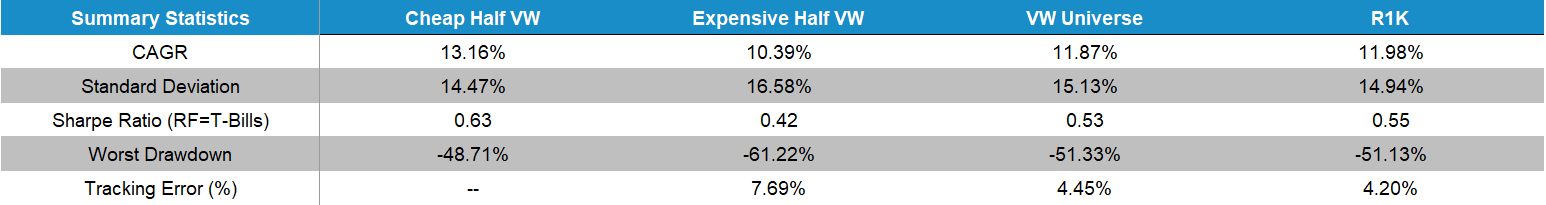
The results are hypothetical results and are NOT an indicator of future results and do NOT represent returns that any investor actually attained. Indexes are unmanaged, do not reflect management or trading fees, and one cannot invest directly in an index.
What one sees is that, over the entire time cycle, there was about a 3% spread between Value and Growth. 5
To drive home an important point here, given our universe is 1,000 stocks, I simply, once a year, split the firms into 500 cheap firms and 500 expensive firms using the P/E multiple and market-cap weighted the portfolio.
Very simple.
Nothing else is done.
Those 500 stocks are followed as a portfolio for one year, and above shows the returns to Value (“Cheap”) and Growth (“Expensive”)..
So what does 3% compound to over 42 years?
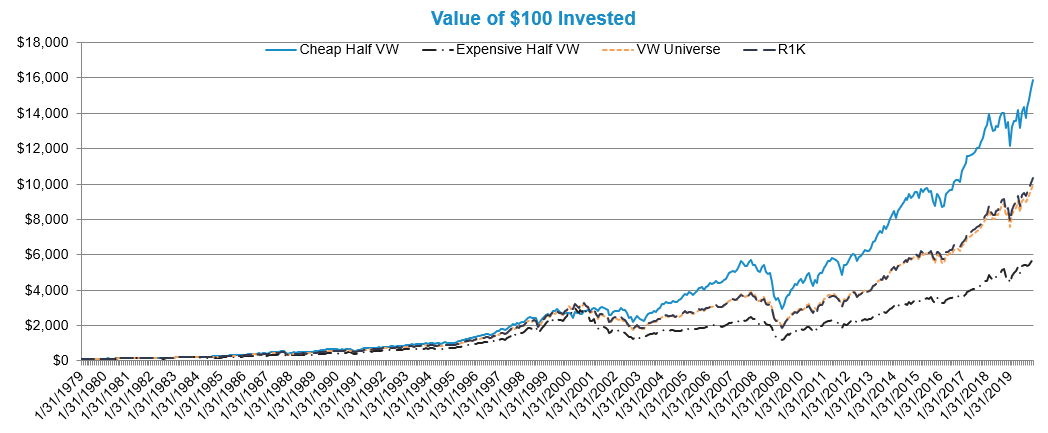
The results are hypothetical results and are NOT an indicator of future results and do NOT represent returns that any investor actually attained. Indexes are unmanaged, do not reflect management or trading fees, and one cannot invest directly in an index.
Thus, the difference is not negligible.
Since I already have the data, I decided to additionally split the universe into Terciles (3 groups), Quintiles (5 groups), and Deciles (10 groups).
You can see the performance below:
Terciles 1/1/1979-12/31/2019:
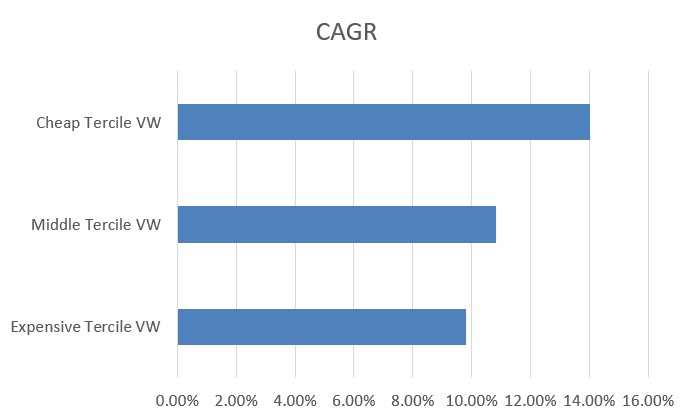
The results are hypothetical results and are NOT an indicator of future results and do NOT represent returns that any investor actually attained. Indexes are unmanaged, do not reflect management or trading fees, and one cannot invest directly in an index.
Quintiles 1/1/1979-12/31/2019:
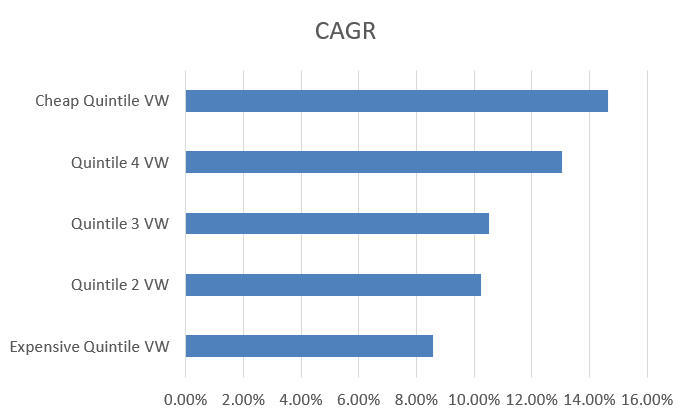
The results are hypothetical results and are NOT an indicator of future results and do NOT represent returns that any investor actually attained. Indexes are unmanaged, do not reflect management or trading fees, and one cannot invest directly in an index.
Deciles 1/1/1979-12/31/2019:
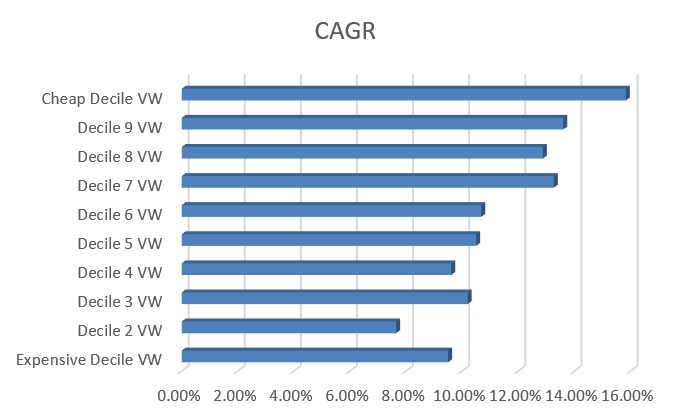
The results are hypothetical results and are NOT an indicator of future results and do NOT represent returns that any investor actually attained. Indexes are unmanaged, do not reflect management or trading fees, and one cannot invest directly in an index.
In general, the more one tilted towards the Value factor, moving from Terciles to Quintiles to Deciles, the larger the spread between Value and Growth.
However, this performance difference is definitely not a free lunch!
As shown near the beginning of the article, the past 10 years, and especially the past 5 years, have not been kind to a Value Investor
Thus, a true Value investor needs to be aware of this and understand the risk.
What about recent performance?
While the data I have above only goes through 12/31/2019, how has 2020 been for a Value investor using the simple P/E splits?
To study this, I updated the data through the end of 7/31 using Factset data to build portfolios as of 12/31/19. 6 One sees that Value definitely continued its underperformance this year. Below examines a simple split using P/E into Quintiles and Terciles, and market-cap weighting the portfolios.
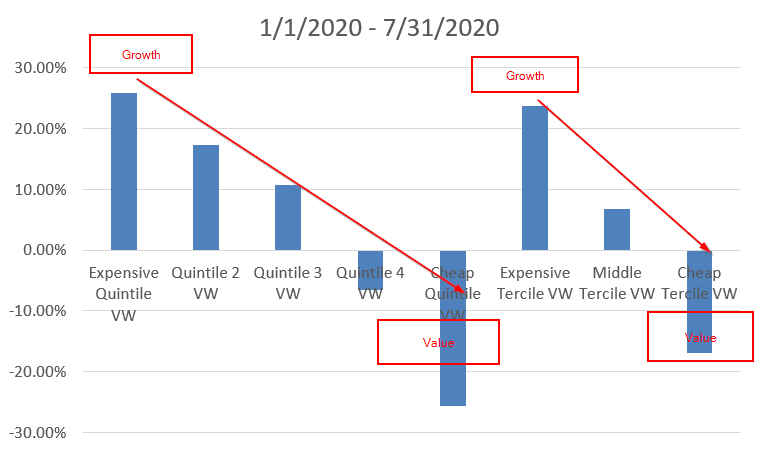
The results are hypothetical results and are NOT an indicator of future results and do NOT represent returns that any investor actually attained. Indexes are unmanaged, do not reflect management or trading fees, and one cannot invest directly in an index.
Thus, Value can massively underperform Growth at times.
However, even if we appended the 2020 data, over the long-run, Value still beat Growth with a simple P/E split (while noting the relative performance shrank in 2020).
1/1/1979-7/31/2020: 7
The results are hypothetical results and are NOT an indicator of future results and do NOT represent returns that any investor actually attained. Indexes are unmanaged, do not reflect management or trading fees, and one cannot invest directly in an index.
So where does that leave us?
The longer I have been in the investment industry, I’ve noticed that people tend to fall into different camps or religions when it comes to investing.
- Vanguard investors — market-cap, low fees
- Dividend Investors — invest in firms paying (higher) dividends than other firms
- Value investors — buy “cheap” stocks
- Growth investors — look for the new “innovative” stocks
Maybe the best outcome 8 is for investors/advisors to match themselves up with portfolios they feel comfortable with and will trust the process.
This simple study highlights (1) one simple approach to Value investing and (2) its performance in U.S. Stocks over a 40+ year period.
Other studies have shown that over long time cycles, and across multiple asset classes, and using different measures, Value investing has beaten Growth investing. However, it definitely won’t work all the time (which is required for it to persist!).
Value investing is a simple concept–trying to buy stocks trading at lower multiples of earnings or fundamentals.
In the past it beat growth investing, but it won’t work all the time!
For a great paper examining whether or not systematic Value Investing is Dead, here is a link to an AQR paper which discusses this topic.
Notes:
- All returns in the article are total returns and include the reinvestment of distributions (e.g., dividends). The results are based on our download of each index return stream.
- You can find a treasure trove of data on Ken French’s website, found here.
- Measured by market cap.
- Prices and returns are from CRSP. Fundamental data is from Compustat.
- Here is the 1/1/1979-12/31/2019 split when equal-weighting the portfolios.
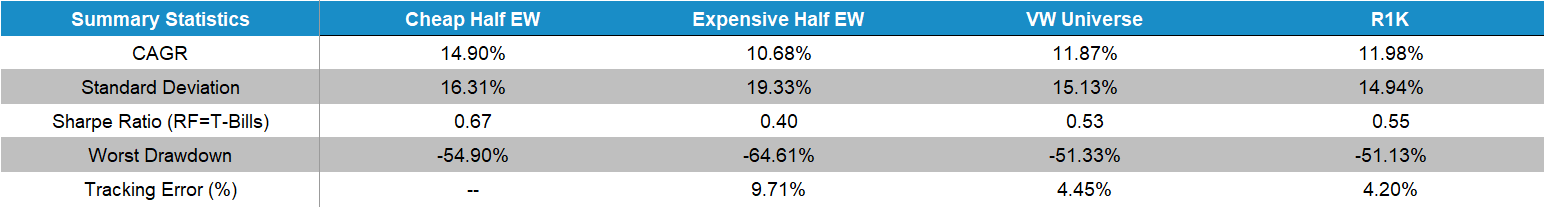
The results are hypothetical results and are NOT an indicator of future results and do NOT represent returns that any investor actually attained. Indexes are unmanaged, do not reflect management or trading fees, and one cannot invest directly in an index.
- Same 3-month lag on fundamental data as before.
- 1/1/1979 – 12/31/2019 Data from CRSP/Compustat, 1/1/2020-7/31/2020 data from FactSet using a similar process. Below is the performance of the Deciles, Quintiles, and Terciles using the same data combination.
 The results are hypothetical results and are NOT an indicator of future results and do NOT represent returns that any investor actually attained. Indexes are unmanaged, do not reflect management or trading fees, and one cannot invest directly in an index.
- From a utility function perspective!
The post “Value Investing: An Examination of the 1,000 Largest Firms” appeared first on Alpha Architect.
The post Value Investing: An Examination of the 1,000 Largest Firms appeared first on ValueWalk.
Sign up for ValueWalk’s free newsletter here.


