

By Jacob Wolinsky. Originally published at ValueWalk.
Logica Capital commentary for the month ended August 2020, discussing scaling S&P puts and calls from their portfolio.
Q2 2020 hedge fund letters, conferences and more
Logica Absolute Return – Up/Down Convexity – No Correlation
Logica Tail Risk – Max Downside Convexity – Negative Correlation
August 2020 Performance*
Logica Absolute Return -1.30%
Logica Tail Risk -2.66%
S&P 500 +6.98%
VIX +1.95 pts
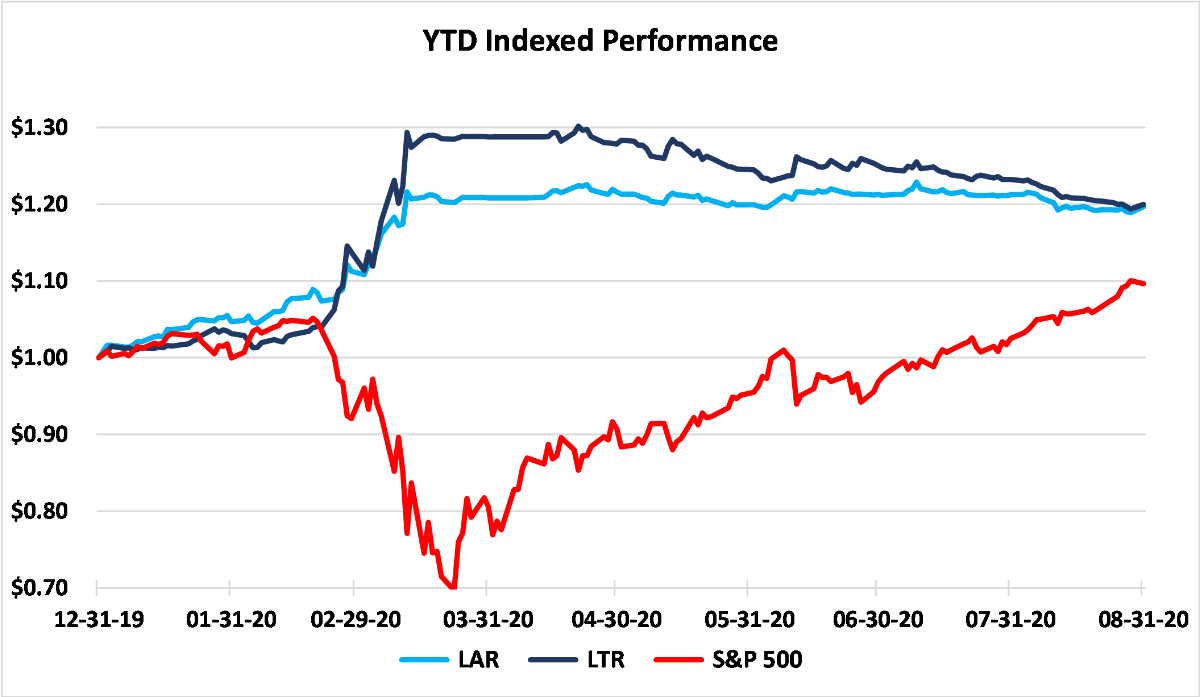
Year To Date Performance*
Logica Absolute Return +19.68%
Logica Tail Risk +19.88%
S&P 500 +9.65%
*Returns are Gross of fees to illustrate strategy performance.
Logica Absolute Return Fund, LP returned -1.41% (net) for August 2020
“Jump up and down and I’ll sing and I’ll shout I got two left feet, I got two left feet” – LZ7, 2017
S&P Puts And Calls: It’s Hard to Go Solo at a Swinger Party
This month was yet another record-breaking month for option volumes and the dynamic we discuss in our recent whitepaper, “Let’s Talk About Skew, Baby!”, was not written with total disinterest for our portfolios.
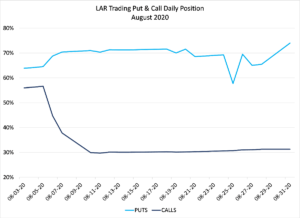
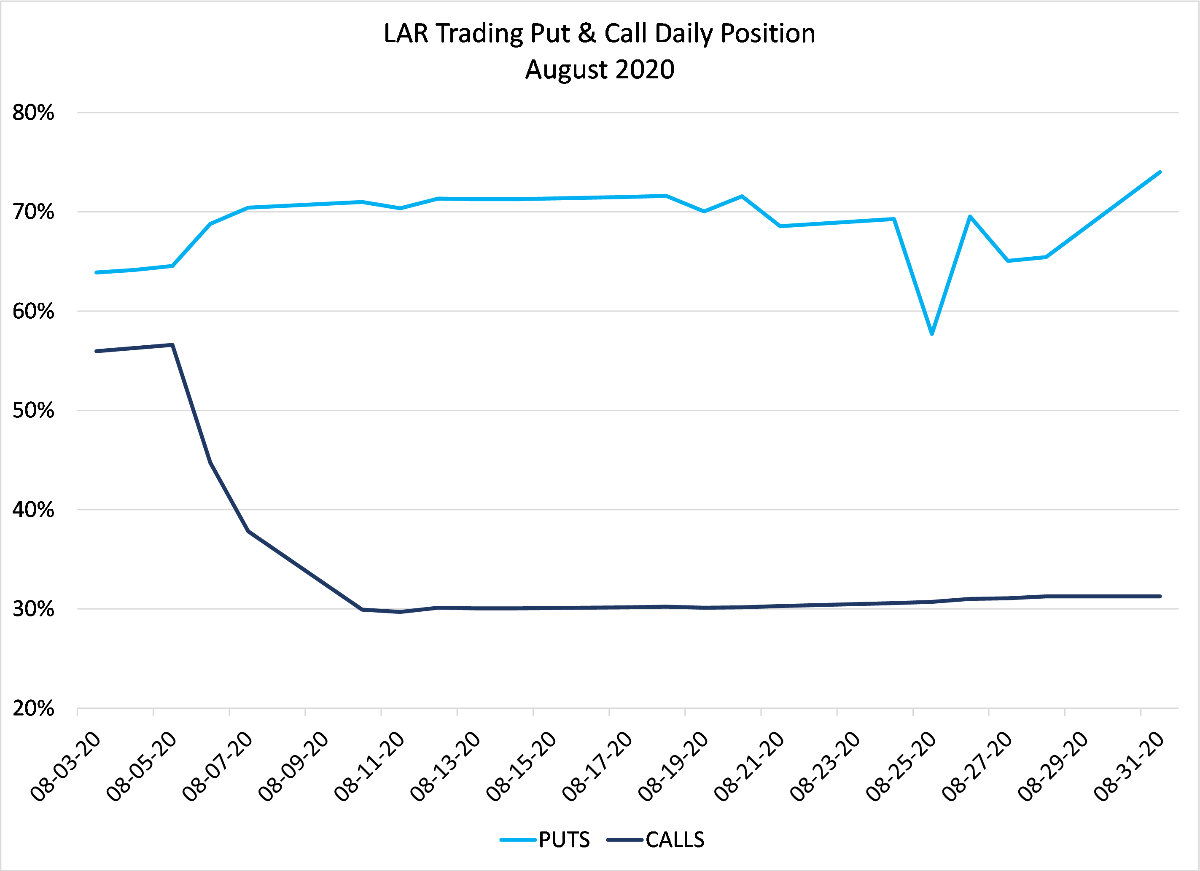
One of the mechanisms Logica uses to defray the cost of being long options (both calls and puts) is a proprietary take on the “gamma scalping” often deployed at dealer desks, which relies on the consistent element of short term mean reversion in the market. Broadly speaking, the natural “noise” of price movement, as the market expands and contracts from side to side while attempting to move its way along a trend creates opportunities for “scalping” those swings. As we illustrate in simplistic terms in our presentation, our process scales in and out of positions in S&P puts and calls by reducing or adding in the over-bought (sold) direction of the local market movement:
While the math is fairly complex, the resulting behavior is expressed as a modulation of the number of contracts that Logica will hold on either side of our “trading” portfolio (composed of S&P index puts and calls). From an implementation standpoint, after we sell, we expect a brief market retreat to give us the opportunity to use an ensuing day to be able to repurchase a fraction of the calls we sold at lower prices. Concurrently, as the market moves higher (lower), each call (put) contract we continue to hold becomes more valuable (gaining both market value and delta) which somewhat offsets the profit taking and incremental capital spent on puts (calls) on the “other side” of the straddle.
In a quantitative system, we necessarily must build our models to reflect “expected” behavior, and this month was anything but expected. If we were to imagine the above graph as a binomial tree, the most frequent outcome is that an up day is followed by a down day. Using the history of US stock markets, roughly 25% of the time we would expect four up days in a row without a meaningful reversal (to reload). 5% of the time, we might expect 17 days in a row without a significant reversal. August 2020 had 20 consecutive days in a row without the opportunity to reload.
If we represent the resulting positioning for Logica graphically, our respective Put and Call loadings for August look less than ideal. Unfortunately, the continuous uplift in August meant that we carried too few calls during a month where the S&P rocketed upwards by nearly 7%, resulting in losses due to our concurrent full put load (which resulted in a short tilted straddle).
Compounding the challenges this month, our stock selection model for our single stock equity calls did not outperform the S&P 500, which was drawn upwards largely on the back of a few technology names from a much publicized single-stock call option buying bonanza. While we believe we have successfully identified the mechanism for this behavior in our whitepaper, our methodology is not designed to capture this rare dynamic. As a result, our combined Upcapture modules underperformed the S&P 500 in a manner that is unusual except for major reversals.
And finally, the challenging dynamic was rounded out by a somewhat surprising drawdown in our macro overlay as all three components (rates, dollar and gold) experienced negative months for the first time in over three years. While the macro modules are an active area of R&D, we do not view this underperformance as indicative of a structural change, especially as each one was well within its acceptable boundary.
While we are not pleased by our performance this month, certainly in the context of the opportunity set, we emphasize that LAR is designed to exhibit zero correlation with the S&P500 over time while delivering positive absolute returns. In a month where numerous aspects of our portfolio performed worse than expected, these results are (unfortunately) within tolerance for our approach. Hopefully, we are our own toughest critics.
“You got me where you want me
I ain’t nothin’ but your fool
Ya treated me mean
Oh you treated me cruel”
– Aretha Franklin, 1967
Well If Our Strategy Wasn’t Working, Who Was?
Another month, another record-breaking decline in the unemployment rate as small businesses continue to indicate near record levels of difficulty in filling job openings. Full confession – this makes almost zero sense.
In July the NBER released a report detailing the impact of COVID-19 on small business:
“The number of active business owners in the United States plummeted by 3.3 million or 22 percent over the crucial two-month window from February to April 2020. The drop in active business owners was the largest on record, and losses to business activity were felt across nearly all industries… Continuing the analysis in May and June, the number of active business owners remained low – down by 15 percent and 8 percent, respectively… The loss of 3.3 million active business owners (or 22 percent) was the largest drop on record. When conditioning on working roughly two days per week or four days a week, the losses are even larger (28 percent and 31 percent, respectively). Total hours worked by all business owners dropped by 29 percent. Although incorporated businesses are more growth-oriented and stable, they experienced a drop of 20 percent from February to April 2020.”
These horrific results are echoed in the initial increase in unemployment, but oddly the recovery in the unemployment rate and the apparently aggressive search for employees are not echoed in a new survey introduced by the Census Bureau in response to COVID-19 induced data uncertainty. The weekly Business Pulse Survey “complements existing US Census Bureau data collections by providing high-frequency, detailed information on the challenges small businesses are facing during the Coronavirus pandemic as well as their participation in federal programs such as the Paycheck Protection Program.”2 Unfortunately, the survey was not continuous from May to current (leave it to the government to decide continuous data series are overrated), but trends do not seem to have shifted meaningfully. The data does not match the improvement shown in headline unemployment, with more business reporting reductions in employment every week than increases. It is tough to see how the unemployment rate falls under those conditions:
Likewise, another “real-time” survey from the Dallas Fed suggests that the employment rate (not the unemployment rate) has barely recovered from the late March lows. Instead of the 6.2% improvement shown by the BLS, this would suggest that employment has only risen by 1.2% and has trended flat to down since June:
All of which is a long-winded way of saying, “We have no idea what is going on and anyone who claims to know is deceiving themselves.”
This point is broadly echoed in an important post by Felix Salmon in August:
“…other aspects of the recession, like the unemployment rate or national GDP, are foundational statistics upon which multi-trillion-dollar decisions are made. Never in living memory have those statistics been less reliable.” 4
We will not know much of the true data for 2020 for several years to come and the echoes of 2020 uncertainty will influence data for the next several years due to seasonal adjustment factors, etc. This complicates discussions of whether markets have diverged from “fundamentals” and makes risk-taking increasingly… risky. Fortunately, we remain positioned with our straddles that create the potential for returns in either direction.
Business Update – Logica Absolute Return Offhsore Fund
Logica will be introducing an offshore version of the Logica Absolute Return Fund in the next few months. If you are an offshore eligible investor currently in our onshore vehicle, we will be reaching out to gauge interest in transferring. If you are a new investor interested in our offshore vehicle, please contact Steven Greenblatt for subscription documents.
Logica Strategy Details
Note: We have comprehensive statistics and metrics available for our strategies, but only include a select few to highlight what we believe is our most valuable contribution to any larger portfolio.
If you would like to learn more about our strategies, please reach out to Steven Greenblatt.
If you would like to speak with Wayne or Mike on their views on Hedge Funds/Investing/Trading and trends they see shaping the industry, please contact Steven Greenblatt at greenblatt@logicafunds.com or 424-652-9520.
Follow Wayne on Twitter @WayneHimelsein
Follow Michael on Twitter @ProfPlum99
The post Logica Capital August 2020 Commentary: Scaling S&P Puts And Calls appeared first on ValueWalk.
Sign up for ValueWalk’s free newsletter here.


