By Jacob Wolinsky. Originally published at ValueWalk.

About one in seven people in the U.S. have student debt. We owe $1.6 trillion dollars across 44 million people. Isn’t it curious that we’re the only country to have this problem? We wanted to dive in to the relationship between government and college, so let’s take a closer look.
Q4 2020 hedge fund letters, conferences and more
What generation is most represented in Congress?
Unsurprisingly, it’s the Baby Boomers. A quick refresher on the generational definitions:
- Silent Generation: 1928-1945
- Baby Boomers: 1946-1964
- Gen X: 1965-1980
- Millennials: 1981-1996
Baby Boomers make up the majority of elected officials across both the Senate and House of Representatives. Here’s the breakdown:
Senate (100)
- Baby Boomers: 68
- Gen X: 20
- Silent Generation: 10
- Millennials: 2
House (439)
- Baby Boomers: 234 (53%)
- Gen X: 139 (32%)
- Silent Generation: 38 (9%)
- Millennials: 28 (6%)
By definition, the youngest member of the Silent Generation is 76 years old. The oldest millennial is 40. It was 1980 when the Silent Generation was in the same position that the Millennials of Congress are experiencing today.
Is political affiliation correlated with age?
Not really. The breakdown of political party by age is fairly even:
Boomers (302)
- Democratic: 153
- Republican: 149
Gen X (159)
- Democratic: 81
- Republican: 149
Silent Generation (48)
- Democratic: 32
- Independent: 1
- Republican: 15
Millennials (30)
- Democratic: 17
- Republican: 13
Are social media followers correlated with age?
Yes. And Millenials representatives have nearly five times as many Instagram followers on average as the next highest generation. Surprisingly, the runner up is … the Silent Generation.
- Silent: 679K
- Millennials: 3.1M
- Gen X: 192K
- Boomers: 66K
This is entirely because of one man:
Remove Bernie from the mix and the average Instagram followers for the Silent generation falls to just 11,000.
The relationship between the government and college: Which party has the most scientists?
I defined a scientist (somewhat loosely) as holding a P.h.D. in any field. 21 out of 539 members of Congress meet this criteria. 16 are Democrats and 5 are Republicans. Here’s the breakdown of specialties:
- Political Science / Law / Government: 10
- Philosophy: 2
- Art Education: 1
- History: 1
- Human Services: 1
- International Relations: 1
- Mathematics: 1
- Physics: 1
- Public Health: 1
- Social Policy and Intervention: 1
- Monogastric Nutrition (I have no idea what this means): 1
What about STEM degrees, at any level?
Forty-four members of Congress hold STEM degrees. The definition here includes any hard engineering, science, math, or education degree. I didn’t include Economics or Engineering Management degrees in the definition. If someone graduated with a dual degree (e.g. Physics and History) I counted it.
- Mechanical Engineering: 4
- Electrical Engineering: 4
- Computer Science: 4
- Biology: 4
- Physics: 3
- Physical Education: 3
- Mathematics: 2
- Elementary Education: 2
- Chemical Engineering: 2
- Biochemistry: 2
- Science In Engineering: 1
- Physics And History: 1
- Molecular Biology And Biochemistry: 1
- Mechanical And Industrial Engineering: 1
- Mechanical And Aerospace Engineering: 1
- Marine Engineering and Nautical Science: 1
- Industrial Engineering: 1
- General Engineering: 1
- Engineering: 1
- Civil Engineering: 1
- Civil Engineer: 1
- Chemistry: 1
- Biological Sciences: 1
- Astrophysics: 1
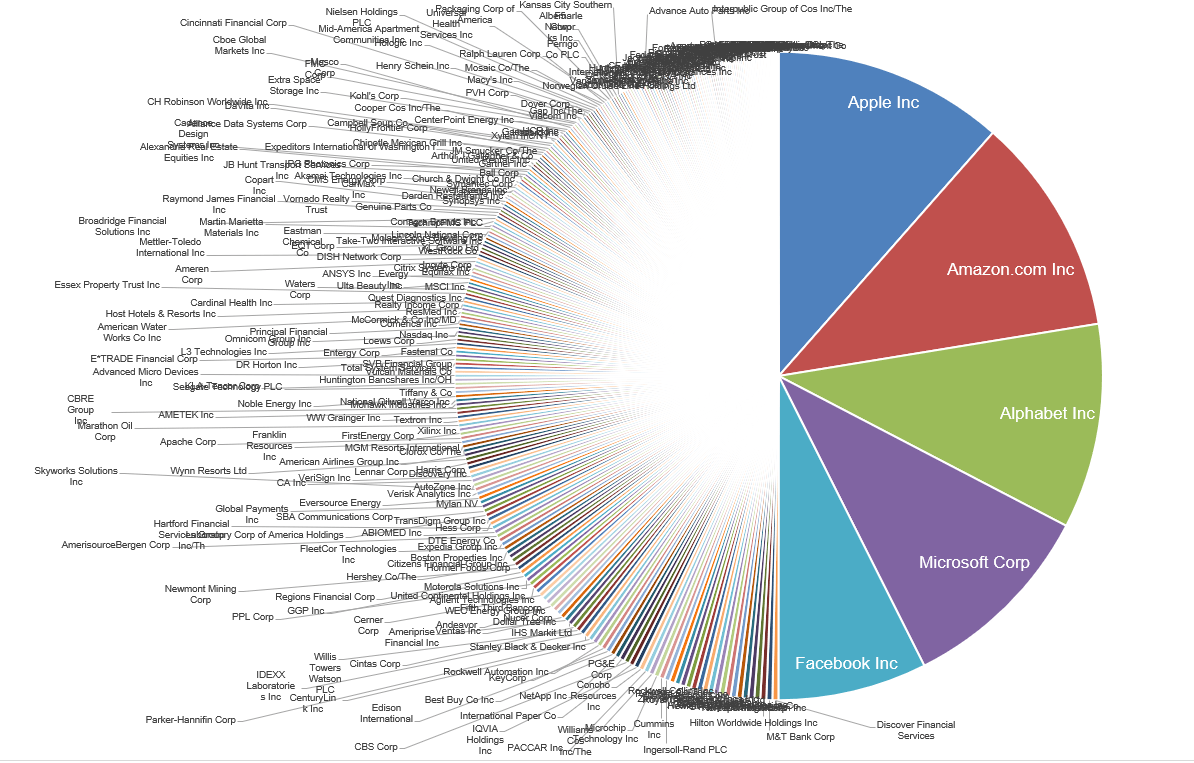
The next chart isn’t from the data, but it’s worth highlighting:
Five firms make up ~50% of the market capitalization of the S&P 500. You’ll notice that all five of them are technology companies, meaning they are built on a fundamental understanding of computer science. It’s interesting that only 4 out of 549 elected legislators have a degree in the field.
Which universities have the most representation in Congress?
- Harvard University: 16
- Stanford University: 15
- Georgetown University: 12
- University of California: 7
- Princeton: 7
No surprises here, although Stanford recently displaced Georgetown for the #2 spot.
What are the most common undergraduate degrees?
- Political Science: 15%
- Law: 10%
- Business Administration: 7%
- History: 4%
- Economics: 4%
Once again, no surprises here.
Rapid-fire facts:
- There are eleven elected high-school / college drop-outs.
- On average, representatives have more followers on Twitter than Instagram.
- Illinois has the most PhDs, followed by California.
- 38 representatives went to an in-state school (12 D, 26 R).
- 17 representatives are doctors (MD).
The post The Relationship Between The U.S. Government And College appeared first on ValueWalk.
Sign up for ValueWalk’s free newsletter here.


