
Courtesy of Market Tamer
S&P 500
Hanging Man on the NASDAQ
Improve Your Market Timing: The Symmetrical Triangle Chart Pattern
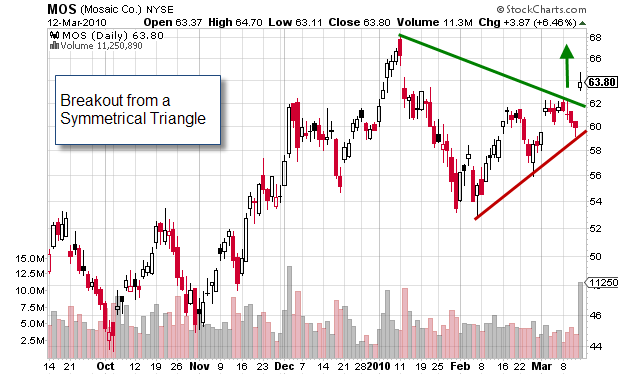
- The Symmetrical Triangle is a continuation pattern that is comprised of two symmetrically converging trend lines. The continuation will normally be in the direction of the prior trend, although at times the pattern can reverse the trend.
- The breakout usually occurs prior to the triangle reaching its apex and is strongest if that is the case.
- The target is the trend line breakout/breakdown plus the length of the widest part of the triangle.
- After the stock has moved either up or down relatively quickly and with increased volume, the stock then begins a period of pause as the stock moves sideways or with a slight retrace against the trend.
- The initial trading in the period of pause consists of a wider amplitude and narrows as the upper and lower trend lines converge symmetrically.
- The investment community is telling us that it is indecisive as to the continuing direction of the stock as the trading range narrows and finally breaks out to resume the trend