
That is my favorite clip from Seinfeld that I often use with Members to illustrate BS market moves. I’m pretty good at spotting fake market moves. As George says in the clip: "I know, I can tell – it’s one of my powers." Fortunately, we are now able to get a visual clue as to what’s real and what’s FAKE by zooming out to the bigger picture and keeping an eye on our charts.
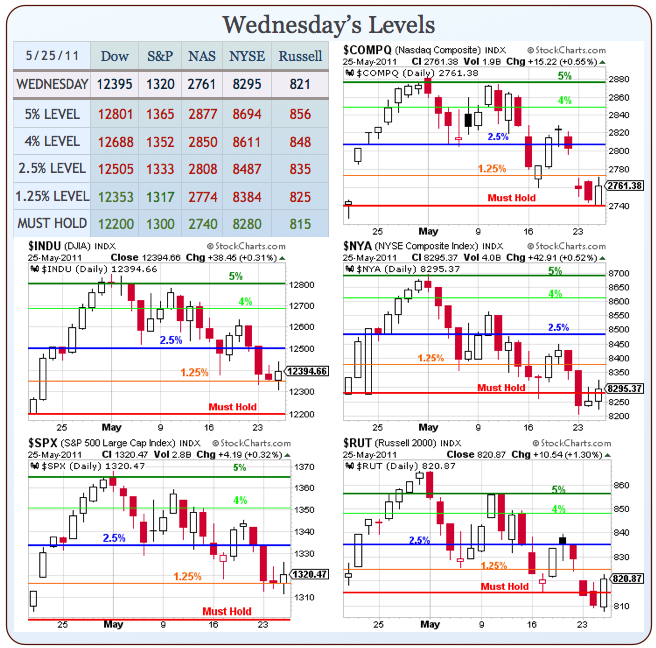
While yesterday’s gains may have seemed exciting, they were actually nothing more than the EXPECTED bounces off our resistance levels – bounces we had predicted back in April, at the same time we predicted the 5% pull-back in the first place. That kept us from buying the dips yesterday, as consolidating near the bottom of our FIRST 5% drop is no reason to go on a buying spree.
Even worse, as I said yesterday about the bounce we were expecting: "Of course, if they accomplish this by knocking the Dollar back below 76, then it will be meaningless." Well, meaningless it was as the Dollar finished the day exactly on the 76 line and, this morning at 6:30, they took it all the way down to 75.60 but the market is, as I pointed out on May 4th – "still too heavy!"
 There’s still time to sell in May and go away, Randall Forsyth writes. Although stocks are off 3% in the month, top technicians see further correction ahead. While the S&P fell through its 50-day moving average, it remains far above its 200-day moving average, a sign the broad market is extended, according to John Mendelson, the esteemed veteran technical analyst. Mendelson likens the stock market to a stretched rubber band in a presentation to ISI clients — just as it was in April 2010 before the S&P retreated 16%.
Meanwhile, the market’s leadership has narrowed while the major averages made marginal highs. The number of new highs has declined steadily while the market’s erstwhile leaders like AAPL, FCX and DE all topped out weeks ago. This is "classic stuff," Mendelson says, pointing to "serious negative divergences" in the stock market. Another warning sign has been the poor relative strength of financial stocks, which has lagged the market for a while. While financials have long ago ceded the market’s leadership, "you do expect them to be in the game," he adds.
I said to Members in yesterday’s Member Chat that the news, including the Durable Goods Report, was so bad it was GOOD. Good in that it puts QE3 back on the table because, clearly, this economy is held up by nothing else! David Fry points out that over $25 billion in POMO was added to markets over the last week:
There wasn’t any seriously positive news to spark a rally unless you believe high energy prices are good for consumers. But, some permabulls got the rumor going that more QE is coming since economic data has been terrible. Completing a string of poor reports, Durable Goods Orders (-3.5% vs -2% expected and +4.4% previously) let bulls know there won’t be any interest rate hikes any time soon. Further given all these reports, next week’s ISM Index should be quite poor.
You’d think higher energy prices would discourage consumer (XLY, SPDR Consumer Discretionary ETF) and retail (XRT, SPDR Retail ETF) sectors but no, they rallied higher. But, upon closer inspection investors should view and would be surprised by the top component weightings for each of these indexes. XLY’s top weights include: MCD, DIS, AMZN, CMCSA, HD & F. XRT’s top weights include: BKS, GME, ANF & SFLY. None of these are what you might expect.

At 8:30 we will get the first revision to the Q1 GDP estimate, which was pegged at 1.8% and, at the time, that was a market booster because it was so low that the Fed HAD to shower us with MORE FREE MONEY. Anything that trashes the VALUE of the Dollar is good for the PRICE of equities and commodities but the real trick is that it’s also been good for Treasuries too – as that’s where the Fed dumps their freshly-minted cash. Forget the fact that 1.8% is just 0.1% better than our WORST quarter of 2010 (Q2) or that the data we are gathering in our current Q2 indicates things are getting worse, not better and forget about the fact that the S&P was PRICED 20% lower last Q2. It’s ALL about the the Dollar, which was VALUED 14% higher 12 months ago – everything else is just window dressing…..
| Category | Q1 | 2010 Q4 | 2010 Q3 | 2010 Q2 | 2010 Q1 |
|---|---|---|---|---|---|
| GDP | 1.8% | 3.1% | 2.6% | 1.7% | 3.7% |
| Inventories (change) | $43.8B | $16.2B | $121.4B | $68.8B | $44.1B |
| Final Sales | 0.8% | 6.7% | 0.9% | 0.9% | 1.1% |
| PCE | 2.7% | 4.0% | 2.4% | 2.2% | 1.9% |
| Nonresidential Inv. | 1.8% | 7.7% | 10.0% | 17.2% | 7.8% |
| Structures | -21.8% | 7.7% | -3.6% | -0.5% | -17.76% |
| Equipment & Software | 11.6% | 7.7% | 15.4% | 24.8% | 20.5% |
| Residential Inv. | -4.1% | 3.3% | -27.3% | 25.6% | -12.3% |
| Net Exports | -$399.7B | -$397.7B | -$505.0B | -$449.0B | -$338.4B |
| Export | 4.9% | 9.6% | 6.8% | 9.1% | 11.4% |
| Imports | 4.4% | -12.4% | 16.8% | 33.5% | 11.2% |
| Government | -5.2% | -1.7% | 3.9% | 3.9% | -1.6% |
| GDP Price Index | 1.9% | 0.4% | 2.1% | 1.9% | 1.0% |
8:30 Update: Well, I’m glad we stayed short and I’m feeling good about the puts we took into the close now. GDP held flat at 1.8% but "expert" economists had expected an upward revision for some reason (obviously not PSW readers) so flat is now disappointing. We’re not expecting a big move down in oil, as it’s the holiday weekend and they want to keep prices high to screw as many Americans as possible at the pumps (it’s almost comical to see how hard they are working to keep gasoline futures over $3) but that didn’t stop us from grabbing USO puts as they gave us a gift yesterday by running the price of oil (certainly not the value!) back to $101 – $1 more than I predicted they would get yesterday (never underestimate the ability of manipulators to make short-term market tops).
 Of course, we can look at this as a "glass half full" as this horrible GDP report can only mean the Fed MUST continue to pump money into the economy. In fact, the Dollar is already falling to 75.45 on this news and that’s masking the pre-market selling by propping up the PRICE of equities and commodities as more worthless Dollars are required to exchange for less valuable shares. Which one will stop going down first is the question. I think the Dollar will hold up before the sellers are done running for the exits but we’ll have to wait for real trading to begin before we know who will win this battle to be the biggest loser.
Even as I write this, I just put up a trade idea in Member Chat to short oil futures at the $101.45 line with a stop if they break over $101.50. As I said in yesterday’s post – if the manipulators want to pretend they want to buy barrels for $101.45, we are very happy to agree to sell them for that price because WE KNOW THEY ARE LYING! How do we know, because last month, the June NYMEX contract finished with 20,000 contracts (20M barrels) open for delivery and that makes sense because Cushing, OK, where the barrels are delivered, can only handle about 40M barrels and they are pretty full. Oil finished out that contract down near $96 a barrel. How did they get it back to $101.50 in a week (the pre-holiday week, where that $5 a barrel translates to $2 a tank from every driver in America)? By PRETENDING that they are interest in buying – get this – 406 MILLION barrels for July delivery:
| Month Click for chart |
Session | Pr.Day | Options | ||||||||||
| Open | High | Low | Last | Time | Sett | Chg | Vol | Sett | OpInt | ||||
| Jul 11 | 101.24 | 101.90 | 100.48 | 101.40 | May 26, 08:54 | 0.08 | 47873 | 101.32 | 406901 | Call Put | |||
| Aug 11 | 101.74 | 102.37 | 100.98 | 101.93 | May 26, 08:54 | 0.11 | 4363 | 101.82 | 93036 | Call Put | |||
| Sep 11 | 102.23 | 102.80 | 101.50 | 102.38 | May 26, 08:54 | 0.14 | 3240 | 102.24 | 99149 | Call Put | |||
| Oct 11 | 102.49 | 103.09 | 101.71 | 102.67 | May 26, 08:54 | 0.13 | 1203 | 102.54 | 47470 | Call Put | |||
Aside from the fact that it is simply not physically possible for 400M, or even 40M barrels of oil to actually be delivered to Cushing, I can tell you FOR A FACT that over 90% of those contracts will not only be cancelled before the expiration date in late June but that they will then be rolled over to August, where the CRIMINALS (alleged by the CTFC) at the NYMEX will then FAKE demand for another 400M barrels of oil. That is TEN (10) TIMES the actual demand. Do you think that affects prices? Of course it does, it’s a $2.5 TRILLION Dollar Global Oil Ccam and shame on you if you read this and just think someone else should do something about it. WRITE TO CONGRESS – STOP THIS CRIME!!!
The usual 424,000 people lost their jobs last week and that’s not actually good as we’re heading into what should be a busy holiday weekend where you would think that hotels, restaurants, airlines, retail, etc. would WANT to have employees on hand. By the way, one of my favorite things in the Governemnt’s GDP Report is the section on Corporate Profits (which, you will be happy to know are up substantially, once again) because, in 6 paragraphs on the subject, the one thing they don’t tell you is what Corporate Profits actually were!
We do know profits "increased $113.8Bn" for the quarter but, whether that is a 1% increase or a 10% increase is a matter of mystery. Why? Because if people knew what the actual figures were – there would be blood in the streets!
Speaking of revolutions – France is planning one over the weekend with major rallies and protests scheduled. Next stop on the Radical World Tour will be Germany (London already went – remember when they attacked Charles in his limo?) but you keep thinking it will never happen here…
 Email This Post
  del.icio.us
  Digg
Digg  Reddit
  Stumble
  Yahoo
Yahoo ![]() Facebook
Facebook ![]() Twitter
Twitter