Reminder: Harlan is available to chat with Members, comments are found below each post
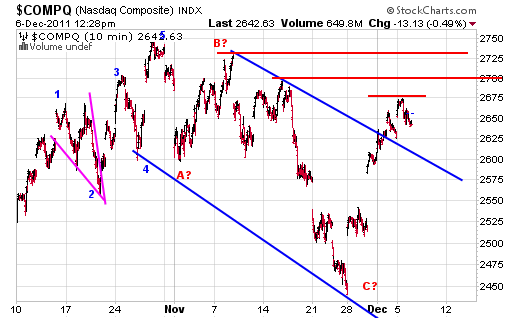
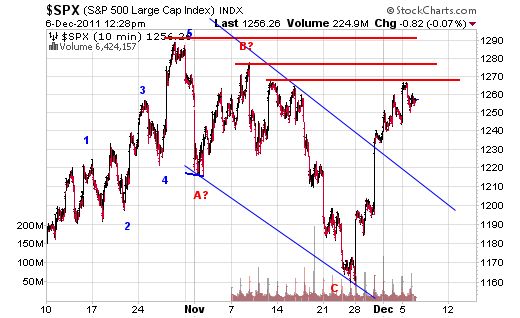
Below are the short term micro index charts.
Imagine that. See where the SPX stopped yesterday? Right at a resistance level. From here lets see if we can get a POH in micro frequency to develop over the next few days. Again IF we are going to go higher one more time into year end then this is just a pullback pause that refreshes as the guy in the white beard from a few days ago would say.
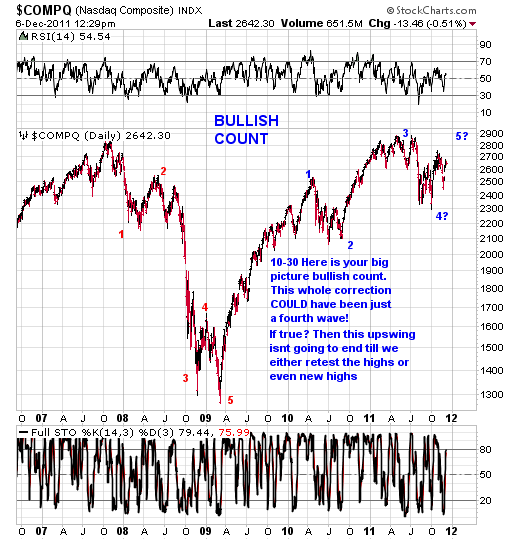
Lets move on to some big picture Bullish and Bearish count charts on the indexes. We talked about showing you all some Ewave 3’s and 5’s So here we are.
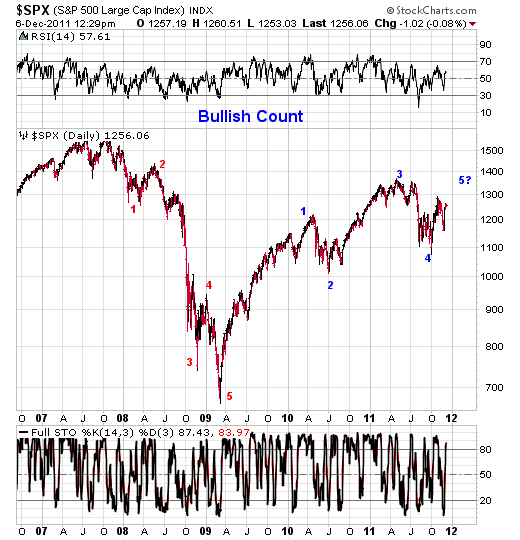
First lets look at the bullish count charts.
For you forward thinkers (Which should be ALL of you) I want you to think about what happens IF this run is a five wave up affair to a retest of the highs. Well on the surface it will look like good times. HOWEVER and this is the important part WHAT HAPPENS AFTER we complete the 5 waves up? Simple answer – 3 waves down at least and the end of this bull-market off the March 2009 lows. CONSIDER YOURSELF WARNED IN ADVANCE!
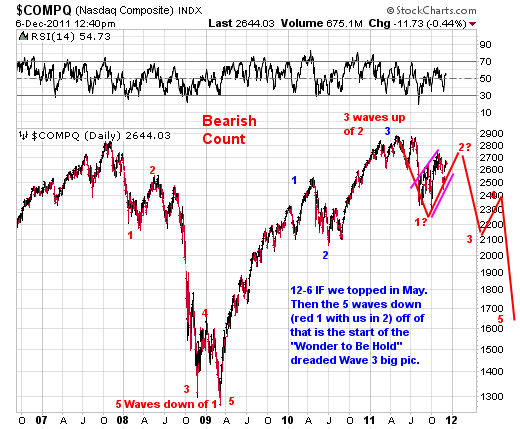
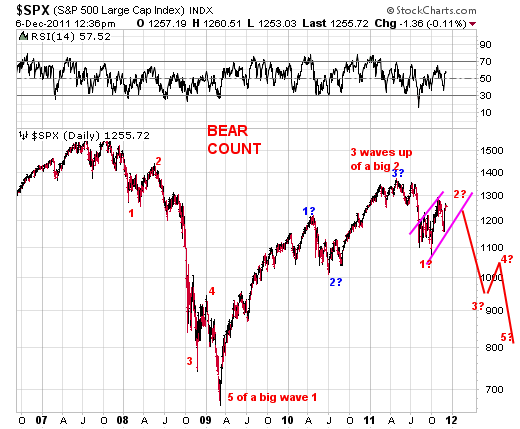
Now lets look at the bearish count charts.
IF this count is correct then we really did top in May with the first leg down (red 1 Oct lows) being complete and all this bounce up off the lows is is just a bear market rally. Given the Debt cycle climate, the political climate both here and abroad that doesn’t "Get It" it would not surprise me to see next year being the nastiest we’ve seen in a long time. Errrr since how about 2008.
Also of note, IF this is the correct count? Know all that 401k mutual fund money of yours that hasn’t gone anywhere in 10 years except with your input and the companies match if available? Its going to take a hit. A1 of money management is PROTECT WHAT YOU HAVE. That means cash is king with no equity risk. If your employer matches you? You are already doubling your money due to the match. How much more do you want?
Don’t get Ewave? Don’t worry about it, all you need to know to get out is to watch the PINK lines on the bearish count charts. A downside break of those gets the ball rolling. Its also a huge opportunity for the short side and for those who can’t short to pick off some Inverse ETF’s.
We’ll be monitoring the situation over the next few weeks and will be featuring them when appropriate.
As far as those pink lines are concerned? Two things (also very important)
1. In between those are whats called a BEAR CHANNEL
2. For those of you who are O’Neil fans if you look in his book "How to make money selling stock short" Its a carbon copy of the diagram on either pages 31-32 or 39. I looked last night for my book for over an hour and I couldn’t find it. Someone let me know if they have they’re copy handy as to what page that diagram is.
At all about trends we call the drop to the Oct lows (red 1) the First Thrust Down. Everything since then (the bear channel in pink) is the snapback rally. Those who have been with us thru thick and thin and not fair weather (and we thank you!) know what comes next IF IF IF we follow that script. Its Bombs away to the downside. The mantra around here is First Thrust Down, Snapback Rally Bombs Away!
Tomorrow we will zoom into some shorter term charts that hone in on everything since the May 2011 highs.
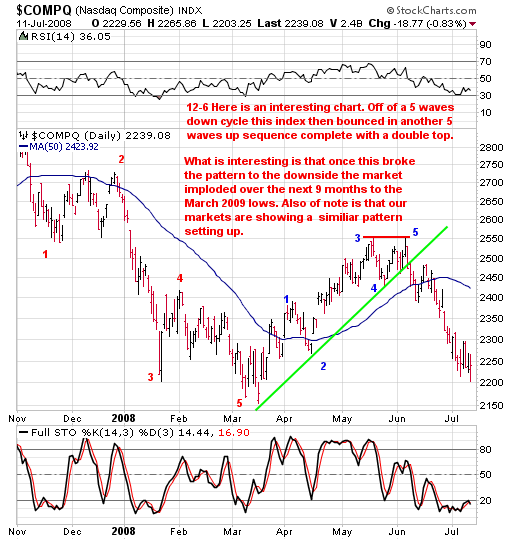
Random Charts Of Interest
First up the NASDAQ comp from early 2008 that’s really interesting and fitting as we COULD be seeing the same pattern just with more wild swings recently.
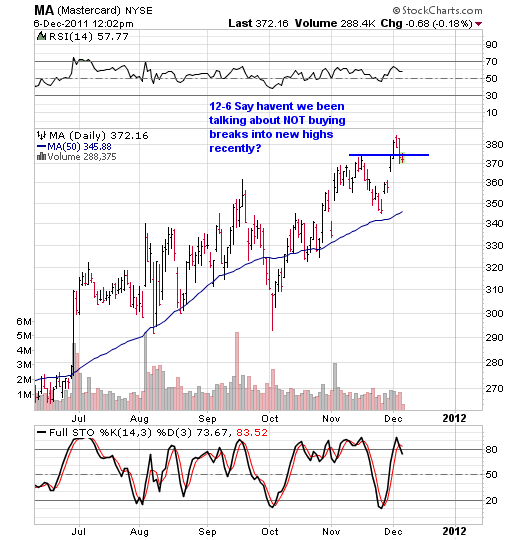
Next up is one of those why we don’t buy breakouts names
The longside trade WAS in the face of fear POH down to the 50 day average. Same goes for N, FTNT too if you get a chance to look at those charts.
SHORT SIDE WATCH LIST
12-5 This is a WATCH LIST and we stress WATCH. DO NOT SHORT ANY OF THESE NAMES JUST YET.
Over the weekend in the change in trends section we said:
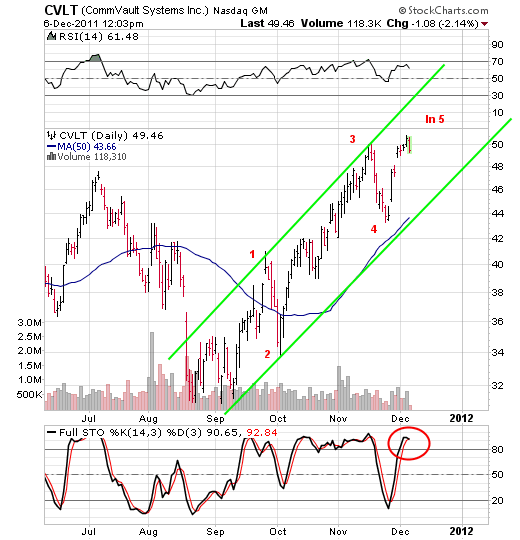
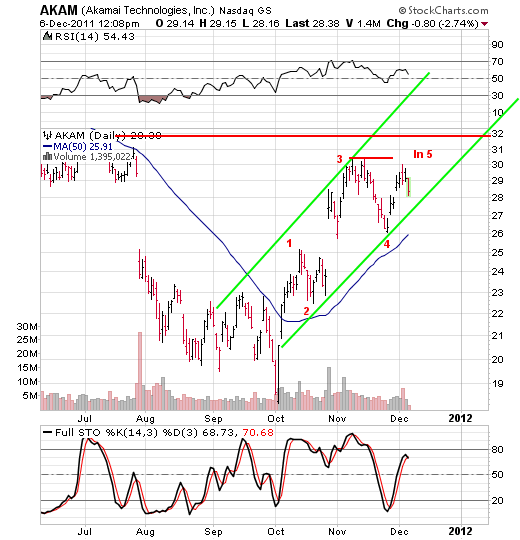
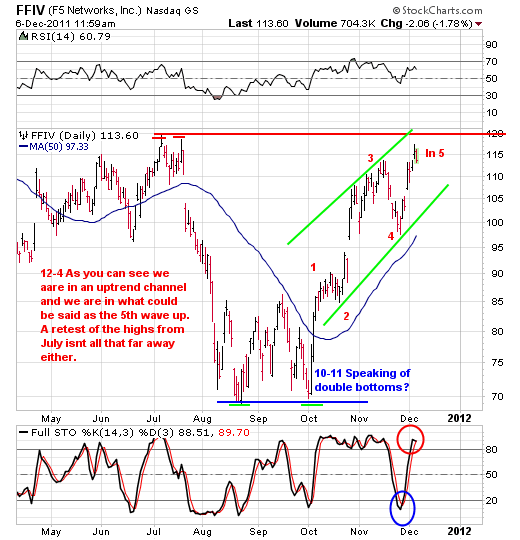
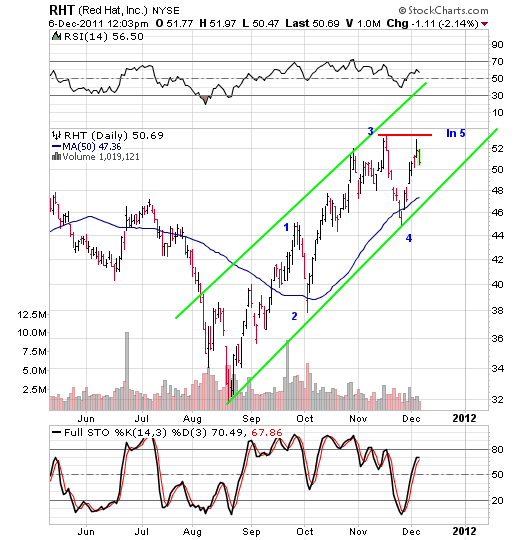
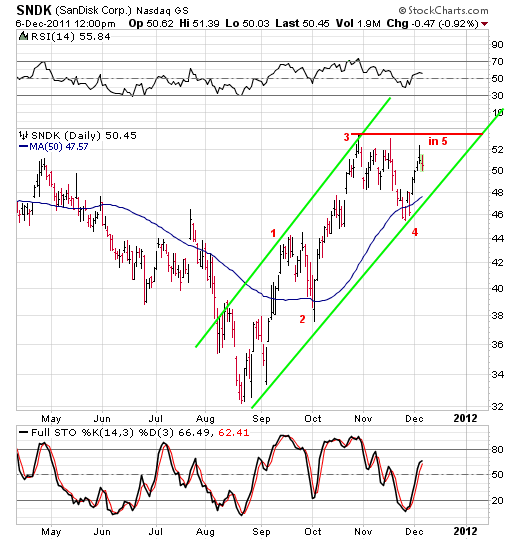
Keep in mind that these names are still in the 5th wave up. This also means that they could breakout into new highs. To the novice IBD type person that would be a breakout to buy (of course in keeping with the trend of gaps and go odds favor they breakout in the form of a gap assuming that is what takes place mind you).
DO NOT even consider that as we’ve seen in detail what has been happening to breakout buyers who operate from looking only at patterns in a sideways horizontal fashion verse multi-dimensional like we do. Not to mention as shown above in the index charts after a gap up they tend to go nowhere right after. Just saying.
All of which makes me say for the most part these issues are toast going forward and will end up topping out and stalling up in here. Said another way, the party ends are midnight and its 11:30 PM with these names.
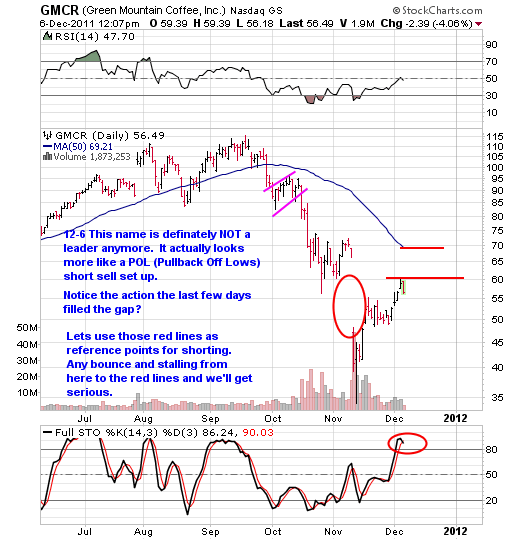
GMCR
NEW NAME TO WATCH and we stress watch
12-6 Given this could just be a pullback in the markets to relieve the overbought nature of things before one more potentially ENDING push higher into year end we’ll just watch this issue to see if it too could get one more final push. Then we get serious on the short side.
The same goes for everything else on this list. Think "Back to The Scene Of The Crime"
CVLT
AKAM
FFIV
RHT
SNDK
LONG SIDE WATCH LIST
"Only The Best And Forget The Rest "
"We Trade What We SEE, NOT What We Think, Hear Or Fear "
12-1 Given what we’ve seen in the indexes the last few days it stands to reason this list should be very small and rightfully so. Until we see some work off of the overbought conditions (sideways or down) this list will stay small. There is enough names out there on the back burner that given some sort of backing and filling and of course some POH-ing that we’ll have enough to work with in the coming days. As they develop we’ll bring them front and center. Right now though let’s exercise some caution as we just ripped.
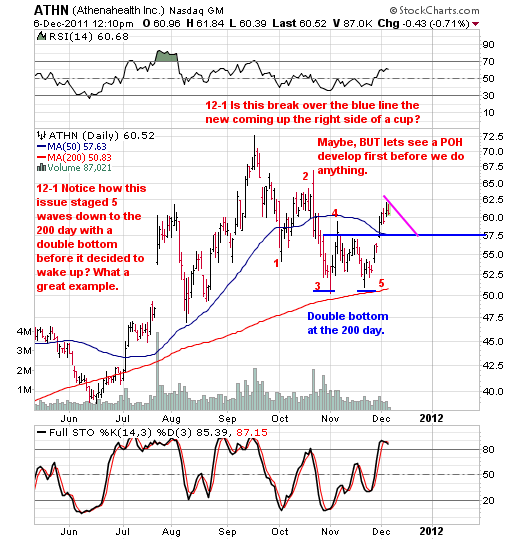
ATHN
12-5 Well you can forget about this one. Not until we can see some sort of pullback and that’s that.
CURRENT POSITIONS
"Let Your Stocks Tell You What To Do By The Action They Exhibit"
NOT YOUR EMOTIONS!
LONG SIDE POSITIONS
12-6
I would not though be a buyer of any of them currently. Sit back and allow them to come to us is the mode that we are in when it comes to deploying money on the longside here. We’re more apt to be sellers soon than we are buyers.
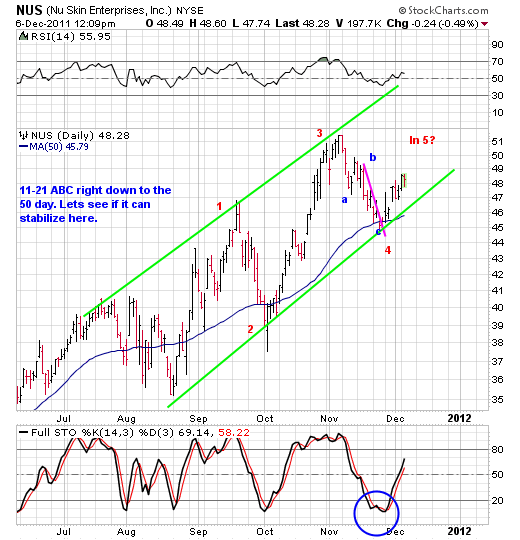
NUS (We are long 250 shares of this at 46.42 as of 11-28-11)
12-5 Looking good. Sure would be nice to catch a three point plus move in here
12-2 Heck at 48.62 its a quick 500.00 worth of gains. The one minute charts show this issue POHing in that time frequency btw. A retest of the highs too though would seriously make us get out much like we did with FIO CVLT RAX.
12-1 Looking ok here. A break below the C (red line) and we have to walk away.
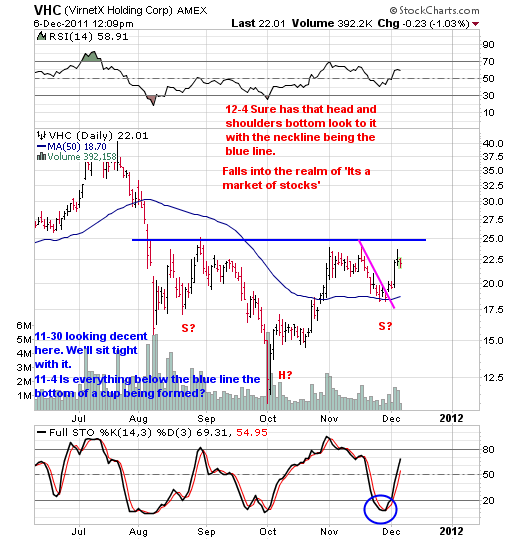
VHC (We are long 300 shares of this at 21.64 as of 11-11-11)
12-5 That 25 level is a resistance level so be aware. What it could do is initially act as a ceiling that will need to be busted thru in order for it to go on a run. IF that issue over the coming days can consolidate sideways and then breakout? Well at that point it could be bought again. Lets watch for a consolidation of this recent move before we consider anything.
12-4 At one point this issue was down for us to the tune of 17% on its own. HOWEVER due to trade size risk management and this issue only making up 3.6% of our overall portfolio the impact to the whole was a measily, stinking, lousy less that 1/10th of one percent!!!!!!!!!
Look (and this is very important) trade size risk management will save you every time! As for the 7-8% traditional stop loss rule that many of you apply? The Gecko says forget about it. In this climate? When you have a market that week in week out puts on 7-10% weekly ranges up and down with most stocks doing double that? You’ll do nothing but get stopped out left and right. Again, this isn’t the 90’s anymore.
An important point we want to make about that is also that about the time you start freaking out with fear (an emotion and you know how we feel about trading off of emotions around here- no wimps allowed) the damage is already done (otherwise why would you be emotional right?). It’s also just about the time the stock is ready to turn too. Those lows were also stabilization at the 50 day on the daily charts. Notice how the technicals were saying to hold on at the end of December by the double bottom? The launch also happened to correspond with the market taking off too.
The point we want to make folks is that there is more to placing stops than just saying heck 7-8% and being done with that.
You have other factors to consider of which the above is exactly those other factors we are talking about.
We’ve even talked in detail here about how you can be down 20% in a growth name and still only have it show an impact to your overall portfolio of only 1% thanks to trade size risk management.
SHORT SIDE
NONE BUT that is going to change by the end of the year!