Reminder: Harlan is available to chat with Members, comments are found below each post.
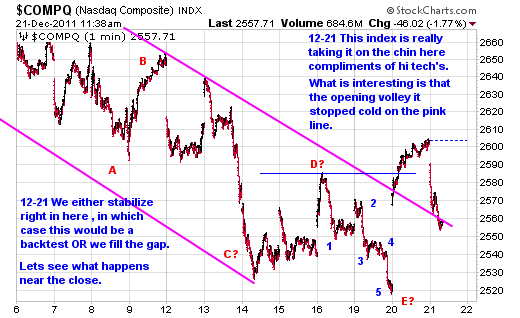
Today its all about Hi Tech taking it on the chin compliments of Oracle. Think guilt by association. I can’t really say much more than that as the charts need more time to show themselves from here (the micro chart frequencies) but when you have a market in gap and go form take off like it did yesterday you create air pockets. Any whiff of anything construed as bad and you get what you got today. That’s a big reason the NASDAQ Comp. is taking the brunt of it as shown below.
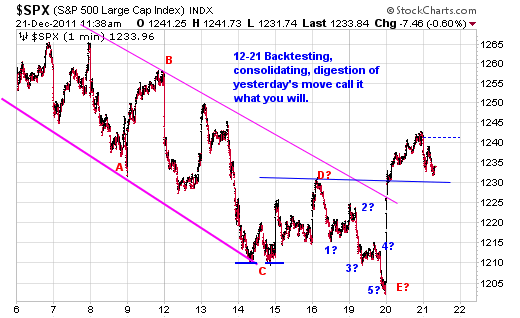
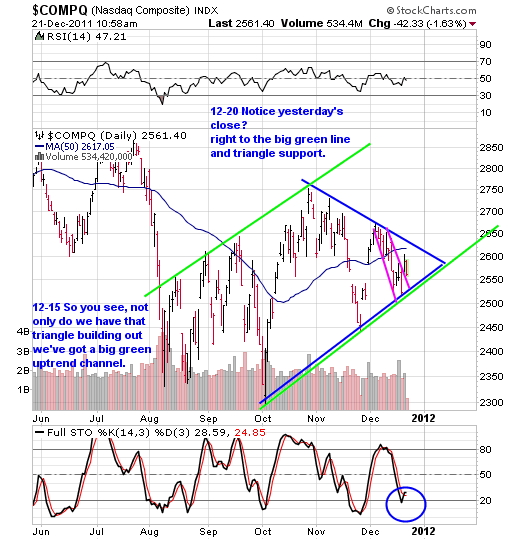
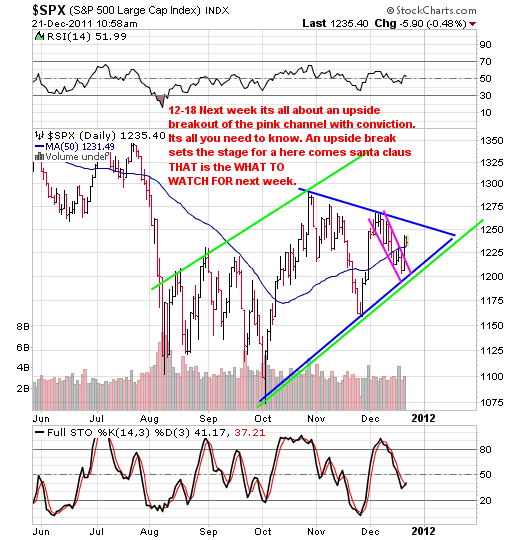
From a daily perspective I can’t yet say anything bad as its looking like backtesting and filling the gap. Albeit it does look nasty for the day in the NASDAQ Comp. The S&P 500 doesn’t look near as bad as the comp. We’ll see. From here on out volume and market participation will probably dry up which can also be a cause for today’s action (think amplifying the moves).
That said, don’t expect a lot between now and the weekend. We have some decent gains in VHC and NUS and who knows we might just ring the register sometime before the weekend and call it a week.
Here is today’s micro charts.
Daily Chart Frequency
What To Watch For, What to Watch Out For
12-20 We’ll keep this conversation front and center for awhile and update the charts so we can see how the conversation impacts the charts.
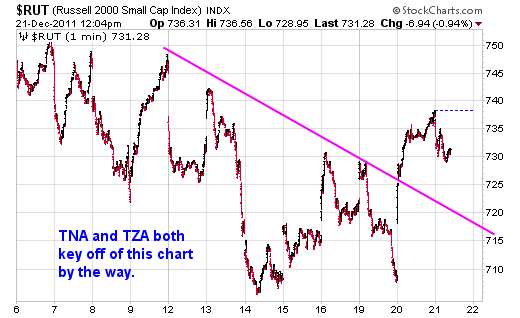
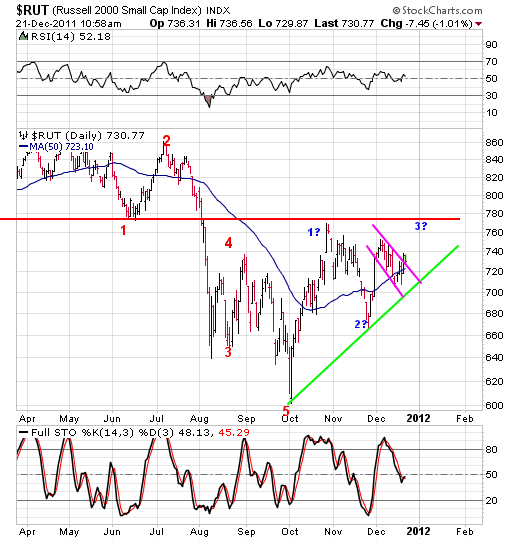
Lets spend a little time talking about this. With every trade you do, what to watch for and what to watch out for are always present. Lets take a look at the Russell 2000 index for a moment.
Much like the S&P 500 and NASDAQ Comp. This index too like pretty much following the same script. Here too, if we are going higher the what to watch for is an upside break of the Pink lines POH.
If we are going lower? The what to watch out for (If long and bigger picture) is a downside break of the green uptrendline.
Keep in mind the what to watch out for on the longside is always the what to watch for on the shortside.
Keep in mind the what to watch out for on the shortside is always the what to watch for on the longside.
I know it sounds a bit confusing at first reading but think it thru. The market is a two way street. As we go forward in time here in these newsletters it’ll become clear so hang in there if you don’t at first get it.
Now lets take it a step further and look at it from a leveraged ETF standpoint via three times market risk (works for you and against you)
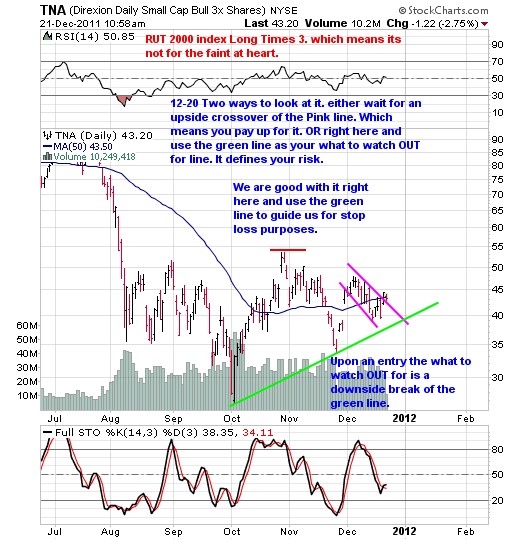
TNA- LONG the RUT 2000 times three
12-21 for now? I have to call it backtesting. Same can be said for TZA below.
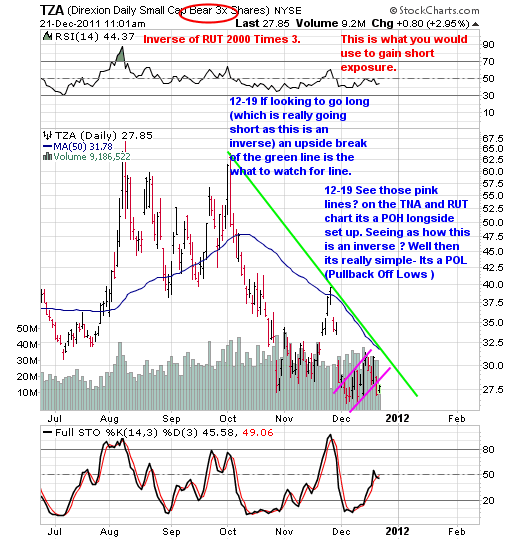
TZA- SHORT the RUT 2000 time three
Yesterday on 12-19 we said:
Its all about the pink lines in the short term. If we are going higher, TNA breaks to the upside, in which case TZA would break to the downside.
Bigger picture, A downside break of the big green line in TNA says we topped and here comes a big correction. The flip side is an upside breakout of the green line in TZA also says the same thing.
========================================================
SHORT SIDE WATCH LIST
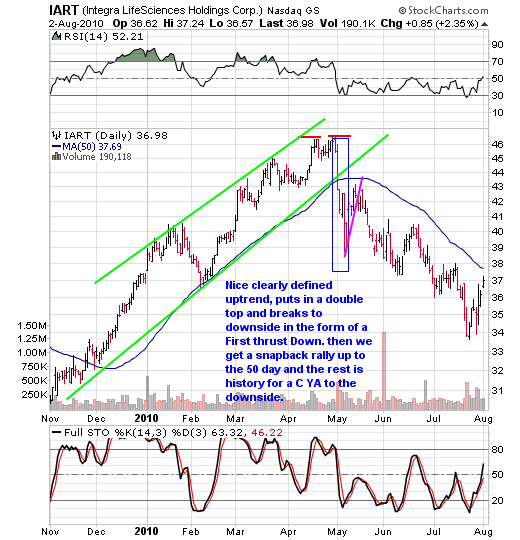
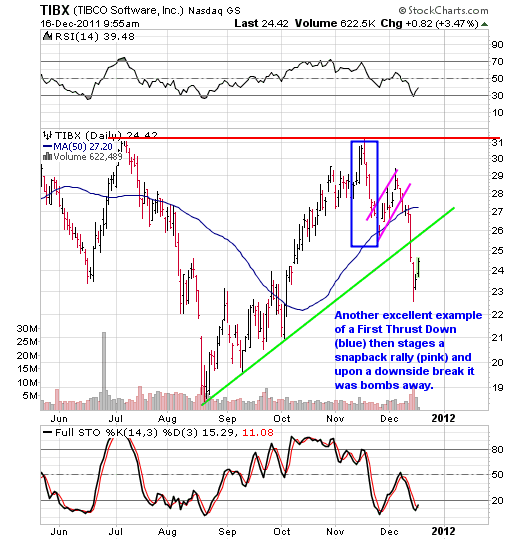
One pattern that we want to be on the lookout for is that of issues stagingFirst Thrust Downs and in the process of putting in snapback rallies.
12-18 All last week we touched upon the First Thrust Down Pattern. Below are a few examples that we’ll keep up for the time being that we can use as a guide for what we need to see to make us take trades on the short side.
From here on out we’ll want to get ourselves prepared for the short side.
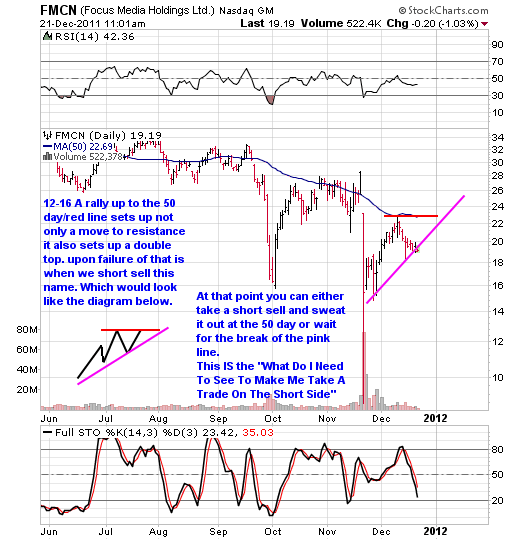
12-18 We know what we need to see to take some killer short sells and one such pattern is above however the market IS the boss and its really just a matter of whether or not we can get some sort of snapback rally, short cover rally call it what you will. Again its all about an upside break of the pink lines in the daily charts, they set the stage.
If we get it? We personally are of the opinion that its the last dash higher and needs to be used to get to cash and either short, get short exposure via inverse ETFs or what have you. We’ll see.
12-1 Below are a few names setting up. With all of the below they are still setting up and need some sort of rally in order to complete the set up. The mantra with these is"
"WHAT DO I NEED TO SEE TO MAKE ME TAKE A TRADE ON THE SHORT SIDE "
Again, this is just a name that needs more time and that we are WATCHING. A rally higher in the markets over the next few weeks will expand this list dramatically. As we see more developing patterns we’ll start adding them to the watch list.
FMCN
12-19 Nothing to talk about here till we see some sort of snapback rally higher for shorting purposes.
INVERSE INDEX ETFs
Many of you know all about these and play them often. For those of you new to the world of inverse index ETFs keep in mind that buying these is the equivalent of having short exposure via the indexes be it hedging long positions that you have owned since time began or to use as an opportunity to profit from. For those of you with IRAs and those who don’t short sell these are basically the only way you can gain short exposure in a down trending market. It’s really simple with these. Market up? These down. Market down? These up.
LEVERAGE
There are three types of these when it comes to market risk.
One time market risk – Market goes up one percent these typically go down one percent. Market goes down one percent these go up one percent.
Two times market risk – Market goes up one percent, these go down TWO percent. Market down one percent, these go up two percent.
Three times market risk- Market goes up one percent , these go down THREE percent. Market down one percent , these go up three percent.
Keep in mind there is slippage and it’s not an exact but dang close. One can also go to proshares.com for a listing of all the choices one has. For now we’ll stick with the two times market risk names of SDS (Inverse times 2 of SPX) and QID (Inverse of NDX 100 times 2). There are tons of these ETFs out there and we’ll consider adding others to this list as time goes on.
These are names we are WATCHING not doing currently. All because we want to be prepared in advance.
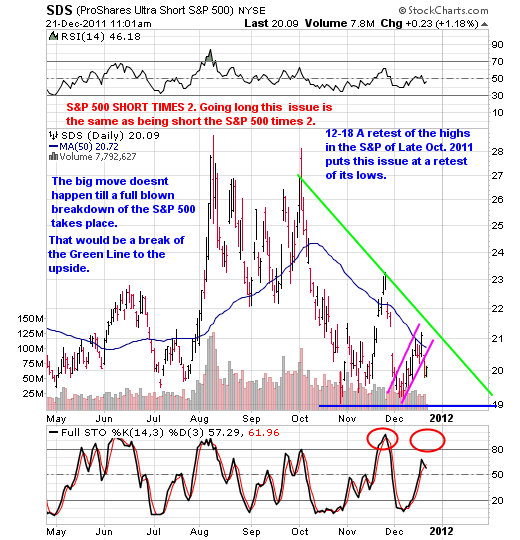
SDS – This is the INVERSE of the S&P 500 IndexTIMES TWO . The S&P 500 goes up, this goes down and vice versa.
12-21 Both SDS and QID are following the same pattern as TNA and TZA in that they are both backtesting.
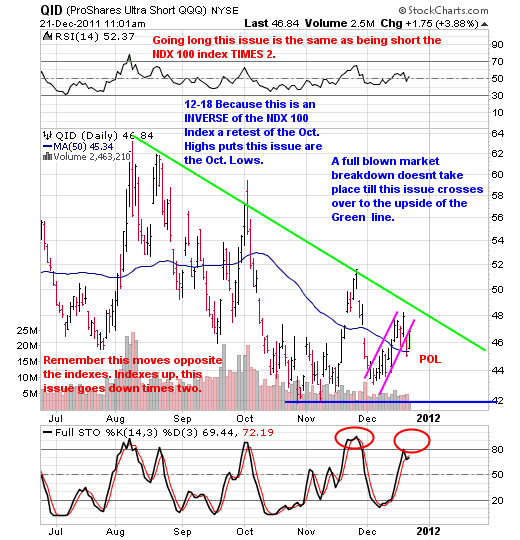
QID- This is the INVERSE of the NDX 100 Index TIMES TWO. The NDX goes up, this goes down and vice versa.
So in a nutshell, IF IF IF the markets retest the October highs and these are sitting at the lows we might just start to pick off a piece to "Be There" and sweat it out a bit. After all we’ve seen time and time again where these markets can spin on a dime in the opposite direction all in the form of a gap. If you aren’t there ahead of that you miss the gains from the gap. This goes both ways by the way.
For now we watch and get acquainted.
==================================================
LONG SIDE WATCH LIST
"Only The Best And Forget The Rest "
"We Trade What We SEE, NOT What We Think, Hear Or Fear "
12-18 We have a few names to work with here. BUT that doesn’t mean you have to do them either you know. You know how we feel about pushing for returns like hot greedy money does right? You might just be better off getting prepared for what happens after we get a push if we even get one. Personally the big money over the coming months in my opinion isn’t going to be on the long side, it’ll be on the short side.
We’ve had a great year here considering what the market has thrown everyone’s way so why get nuts and run the risk of screwing it up. Again, going forward we’re more interested in WHERE THE BIG TRADES ARE OVER THE COMING MONTHS.
If we do any of these its going to be of the get in get out scalps variety. Let’s see how we open on Monday. Personally we’d like to see some morning weakness but the market is the boss not us.
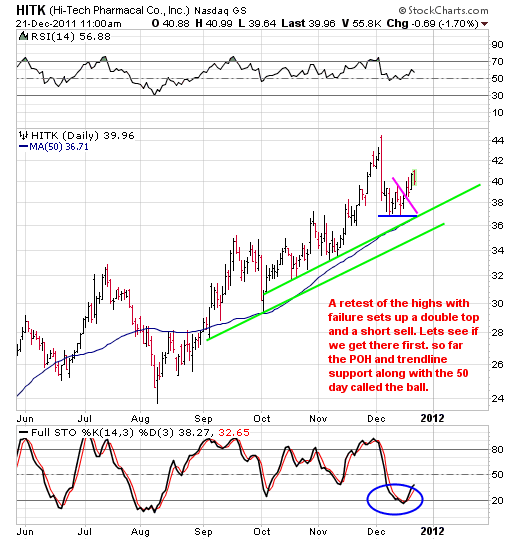
HITK
12-21 Come on! Retest of the highs gets me salivating on the shortside. This name now gets moved to the short side watch list after today. If you didn’t go long in the 36 to 38 range don’t bother.
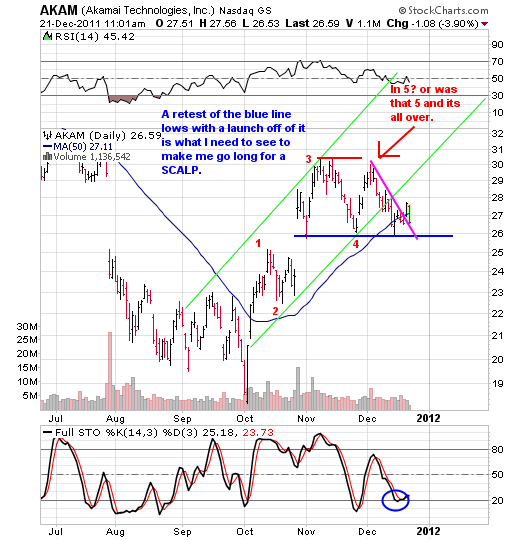
AKAM
12-21 Caught in the Hi Tech downdraft today and is considered backtesting.
12-18 It’s all about an upside crossover of the pink line (12-19 That is the what to watch for, with conviction I might add) for those buying strength but when buying strength be aware of whipsaws. For those who use weakness (as long as there is structure to work with mind you) 26ish is a support zone.
11-18 Gosh, 44 to 47? Thanks anyway, that was a whole trade in itself the last two days.
==================================================
"Let Your Stocks Tell You What To Do By The Action They Exhibit"
NOT YOUR EMOTIONS!
LONG SIDE POSITIONS
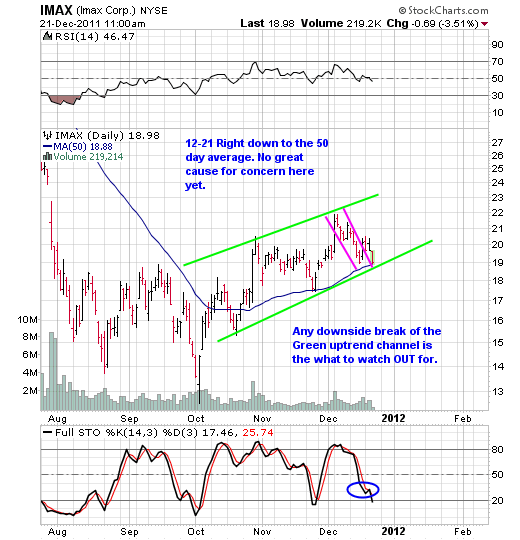
IMAX (We are long 300 shares of this at 20.10 as of 12-20-11)
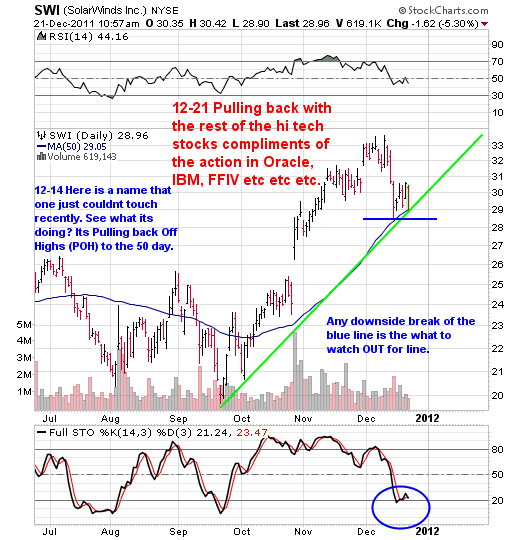
SWI (We are long 250 shares of this at 30.02 as of 12-20-11)
12-21 Caught in the Hi Tech ORCL guilt by association today.
12-16 Hmmmm a retest of the lows from a few days ago with a launch off of it higher? (12-19That is the What to watch for) Sure that’s what we need to see. If that’s the case? It’s that micro 5th wave that would be in play. Market makes the call.
12-15 This name currently looks decent here. We doubt it retests it highs but for a hit and run? Let’s get to Friday afternoon first. The flip side to this that a bounce in this name could be just that, a bounce that sets up a right shoulder of a head and shoulders top or a bear channel, snapback rally just like SPRD did and then rolls over. So we really could be looking at two trades coming our way over the next few weeks with this one.
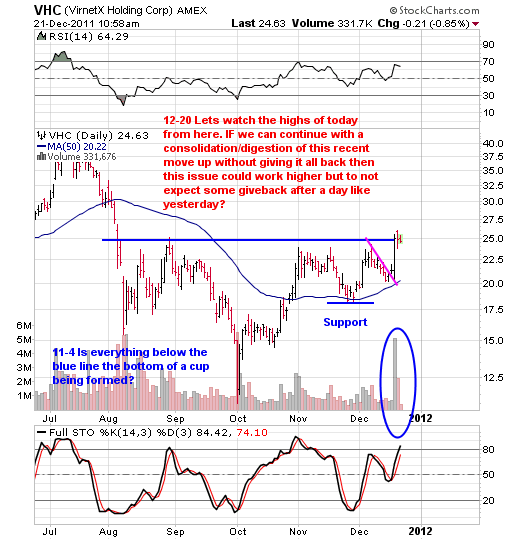
VHC (We are long 300 shares of this at 21.64 as of 12-13-11)
12-19 A downside break of the blue support line is the what to watch out for considering we are long
JOY (We are long 150 shares of this at 87.13 as of 12-13-11)
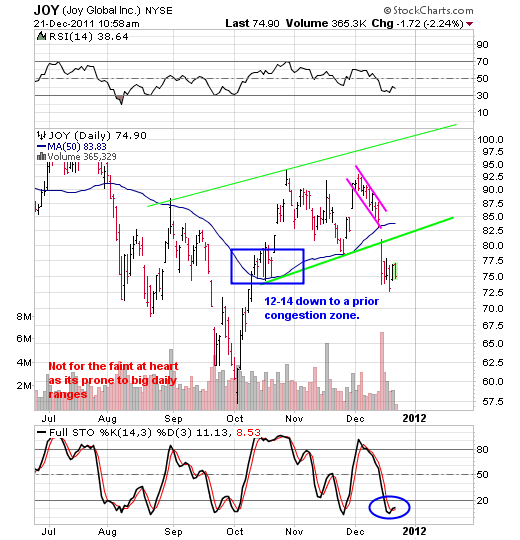
12-21 Content just marking time here.
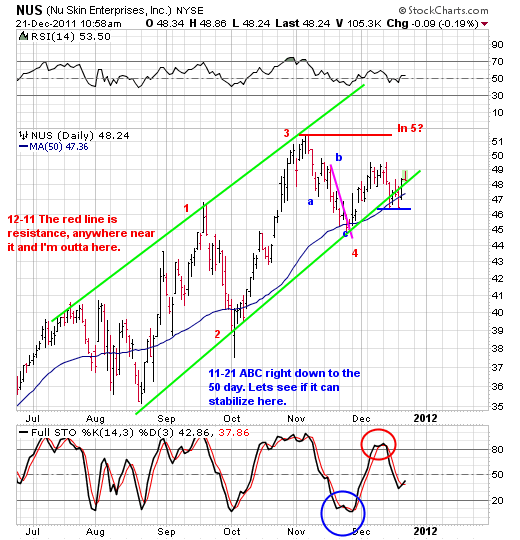
NUS (We are long 250 shares of this at 46.42 as of 11-28-11)
12-20 See the small blue line? It stopped right where you wanted to see it stop. At a prior low.
12-18 Actually a retest of the recent highs at 49.50 might just be good enough for us.
12-1 Looking ok here. A break below the C (red line) and we have to walk away(12-19 And that is the what to watch out for considering we are long).
==================================================
To our NEW SUBSCRIBERS
What we’ve tried to do is break our watch list down into chart pattern recognition structure from a visual standpoint. Learn the patterns and the components of patterns and you’ll blow those Wall Street MBAs away. You don’t need a $3,000 software program either. All you need is a BURNING DESIRE to be the best that you can be and we’re here to help.
We have a lot of new folks here and we thank you! We want you to take it easy, get to know how the routine works around here for awhile and to feel comfortable.
We hope you all aren’t here because you are chasing performance. For us it’s more about educating and making you the best you that you can be first (that’s what we focus upon!). Like many of our long time subscribers they have all found out that they have no use for traditional Wall Street (and we don’t blame them) and it’s our hope that over time you’ll have acquired enough knowledge from us to say the same with conviction.
One of the most important things we want to stress is that of RISK MANAGEMENT via POSITION SIZING. You don’t need to stack your account with just a few big positions as we’ve seen it time and time again that those who get into trouble are the ones who take large positions and do not employ any risk management system IE shoot for the fences. Those are the people who live on the fringes of extremes and yes ultimately get burned.
As a guideline a good initial system is that of the following example.
Let’s say you have a $100,000 portfolio and let’s say that as a guide you never place more than 10% ($10,000) into any one position. Now let’s say that one day a news driven event hits (over which you have no control over anyway) and one of the positions tanks 20%. On its own that position is sporting a $2,000 loss, while that may seem devastating on its own its really no big deal overall.
Why? Simple its all about risk management being properly employed. What is the impact of a $2,000 loss to the TOTAL VALUE of the portfolio in this example.
Answer: A whopping 2% LOSS. Now you know why we say no big deal.
We can also tell you new people here that you will get stopped out of names and you will take hits. There is nobody on the planet living that has ever hit 18 holes in one and there never will be. We’d rather get you grounded in reality right away vs talking about pie in the sky all the time like a lot of other sites. In so doing your head is screwed on straight from the start and when those days happen (and they will) mentally it won’t mean a thing to you. To us that’s what’s most important is YOUR state of mind as it’s your most important asset. We hope you appreciate our honesty.
We have a very good retention rate here at All About Trends and a lot of great outstanding people here. We like to think that a part of that is being upfront about what can happen (in both directions). Verses those up 500%, I turned $50,000 into $3 million or some other absurd number to get you to bite. That’s not who we are.
WELCOME ABOARD!
==================================================
Lastly with regards to taking any trade:
Remember the moment you take a trade you are at the mercy of the market and have no control except when to sell. If you are not willing to take the risk and are not willing to pay that price do not take the trade. We are willing to take that risk knowing full well the end result could be a loss. That said make sure that portfolio management trade size is used accordingly. With any position you may take make sure that should something go awry the amount of total impact to your account does not devastate your acct. Try to stick to a 5% position That’s the key to portfolio management, not biting off more than you can chew.
Remember the mechanics of reality with regards to the stock market states a stock can only do one of three things: Up, Down, Nowhere. The moment you hit the enter button you are at the mercy of the market therefore the only control you have is when to sell/cover. You can’t manage your gains as you have none to manage initially. Knowing this in advance it allows you to stay in outcome, that being you will either:
1. Make a gain
2. Wash
3. Get stopped out at a loss
Remember the market IS the boss. IT is going to do what IT wants to do.
==================================================
OPTIONS — Your best friend and worst enemy
Let’s talk about options for a moment. First off this is a big universe with a lot of advanced strategies and terms like theta, delta , straddles, butterflies and the whole gambit. For the purposes of this conversation we’ll keep it real simple and not try to get to deep.
We’ll approach it from simple buy puts (short side) buy calls (long side). The first thing I want to mention is that options attract the fast money crowd in hopes of turning 500 into 10,000 overnight. This is also the get rich quick crowd. And more often than not these type of people get broke faster than they get rich. Please don’t be one of them as greed kills.
Time and time again we hear from people who like to trade options, and time and time again we hear the horror stories too. When we hear the horror stories nine times out of ten we can guess as to why their option went to zero. Nine times out of ten it was because they bought out of the money options or at the money options. This is the reason why 80% of those who do options lose money by the way.
Sure there are folks who use out of the monies and at the monies but those are experienced traders that know the ins outs ups and downs.
You see the trick is to NOT pay for time. You want as close to a point for point move as possible with the stock because there is nothing worse than seeing your stock move yet your option does nothing or very little, know the feeling?
So for All About Trends we only want to look at IN THE MONEY CALLS OR PUTS and we DO NOT WANT TO PAY FOR TIME, sure they cost more BUT we want to be as close as possible to being able to see a point for point move with the stock.
We hate paying for time. We want true value without the time. We’re not saying our way is any better than others, we’re just saying it’s what works for us.
Now let’s touch upon how we would build a portfolio dedicated to options and how to make it a piece of your overall portfolio via allocation. Keep in mind this is more geared towards beginners so you advanced people might be bored with it but then again it never hurts to revisit the basics every now and then.
At All About Trends Trends we talk a lot about never biting off more than you can chew and trade size position management. We do that for a reason, we do it so as to when Murphy’s law shows up it never devastates us or blows us up. Typically we try to stay within a 5-7% position size when we do a trade. The same thing goes for options. If we were to start a portfolio of options or shall we say allocate a portion of our overall portfolio to options the way we would look at it is the following:
For example, let’s say the total value of your portfolio is $100,000. The most we’d consider allocating towards an options strategy is 10% of the whole portfolio. In this case $10,000. So now you’d have a $10,000 option portfolio to work with. Now let’s say that you are the worst trader on the planet (we doubt that!) and you lose the whole option portfolio, what’s the risk to the total value of the overall portfolio? 10% in which case you live to play another day. Now let’s touch upon that $10,000 you allocated toward options. Let’s reduce the risk even further (and we haven’t even talked about what stocks to trade yet). Let’s take that $10,000 and split it up into no more than 10% ($1,000) can be allocated to anyone position as a guide. (Sometimes 1000 can get you 3-4 contracts you know). Now let’s say that one of those positions goes bust (and they will! and sometimes more than one at the same time we assure you.) What is the total impact to the overall options portfolio? 10% right?
Now let’s take that a step further. What’s the total impact to the overall investment portfolio of 100,000? 1% – that’s right 1 measly percent. When it comes to options you need to employ some sort of portfolio risk management structure parameters as this way you can get in trouble and you don’t lose sleep – you just have a bad day that’s all.
As for getting rich overnight? Forget about it. That’s just a marketing ploy. As for taking 50,000 and turning it into millions? Ain’t happening overnight but it sure sounds good doesn’t it? And that is why people bite on those marketing ploys.
As for time? We never go out months. As a swing trader we’re in positions for only a couple of weeks best case so why pay for the time to go out further in time when you don’t have to. When the stock moves whether it’s right away or not they sure seem to suck that time out of you just as fast anyway right?
Typically we’ll look at the front month (current month) or the next month but not months. When we say front month if options expiration is a week or sometimes even two weeks away we’ll look out to the next month and not the current. While time is our enemy in most cases, in this case it’s your friend. It’s just that you don’t want to pay for it.