|
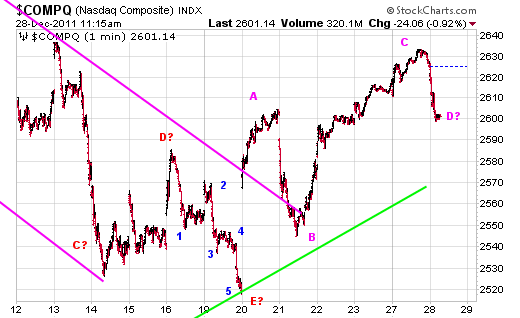
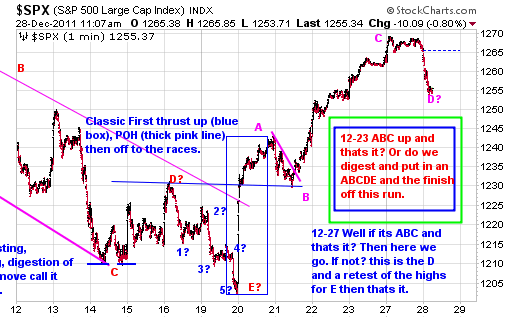
All we need to know for now can be found in the short term micro charts that cover everything from the December lows (December highs in the inverse ETF’s)
A retest of the highs and struggling at that level from yesterday with failure and I’ll want to nibble on some shorts and inverse ETF’s
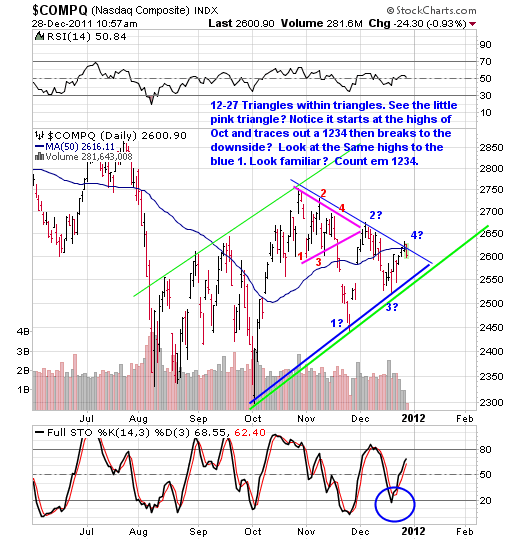
And as for the triangle that’s out there? Well there MAY be a new development as in a triangle within a triangle out there. Check out the NASDAQ Comp. chart below
Until it breaks? We have no clue as to which one is going to call the direction. The big blue one off the Oct lows (bullish because it starts at a low and moves higher) or the one that’s building itself off the October highs which starts at a high and moves lower (bearish). Market calls the ball but I will say I am seeing a lot more bearish channels forming in individual stocks so i have to lean towards the bear side because I trade what I see.
Short Sell Set Up Pattern Of the Day (What To Watch For)
In Summary:
Use strength to lighten long exposure and use this time to brush up on shorting skills and formulate YOUR game plan as to how are you going to accomplish your goals in 2012 REGARDLESS of what the market throws at you. After all life is NOT a spectator sport you know.
We’ve already started to do that for you with what to watch fors and what to watch out fors and will continue to expand upon all that as we move forward in time.
12-28 Any strength from here and we start selectively nibbling on the short side and on those Inverse ETF’s so as to be there.
========================================================
SHORT SIDE WATCH LIST
12-28 From here on out we’ll want to get ourselves prepared for the short side. A lot of these are getting close. Any bounce from here in the market and we start nibbling to "Be There" and then sweat it out while in the zone.
See how big this list is getting? That ought to tell you something.
"WHAT DO I NEED TO SEE TO MAKE ME TAKE A TRADE ON THE SHORT SIDE "
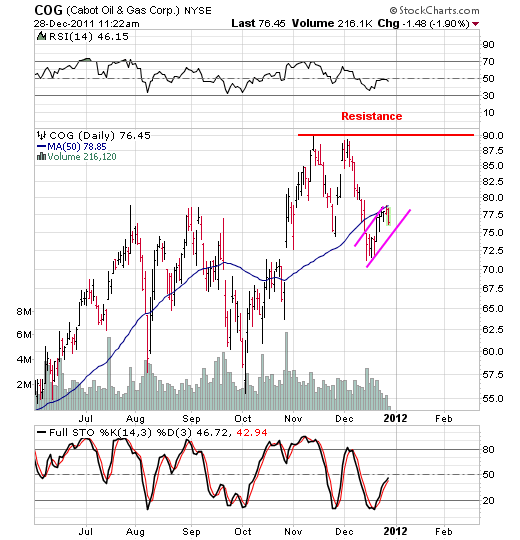
COG
NEW NAME
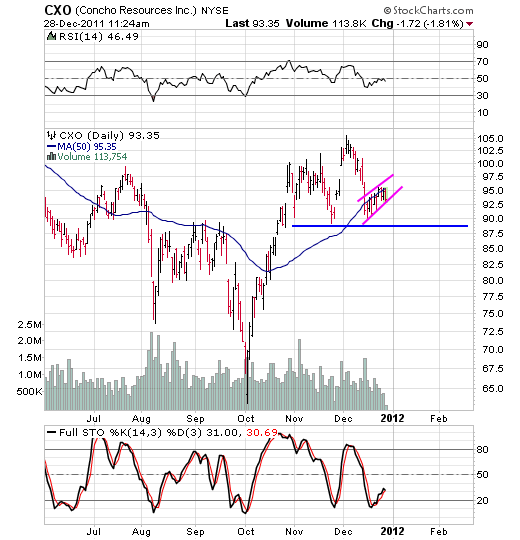
CXO
NEW NAME
EOG
NEW NAME
12-28 Notice a theme with the top three new names? ENERGY.
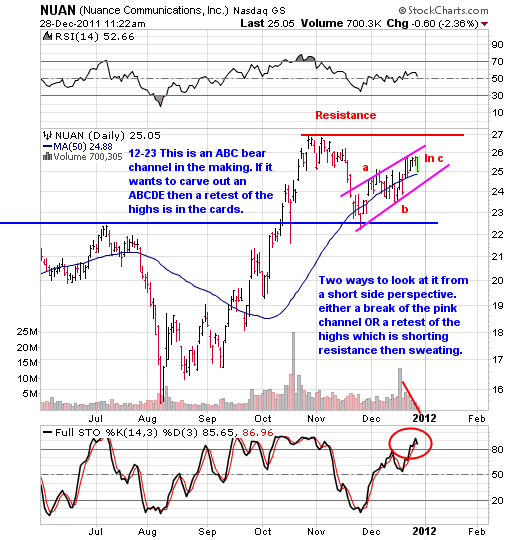
NUAN
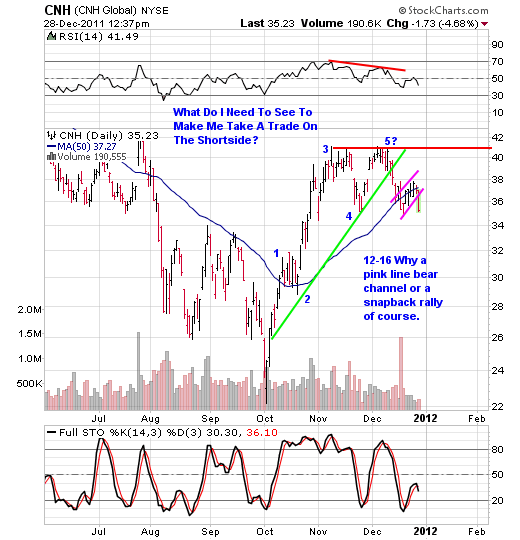
CNH
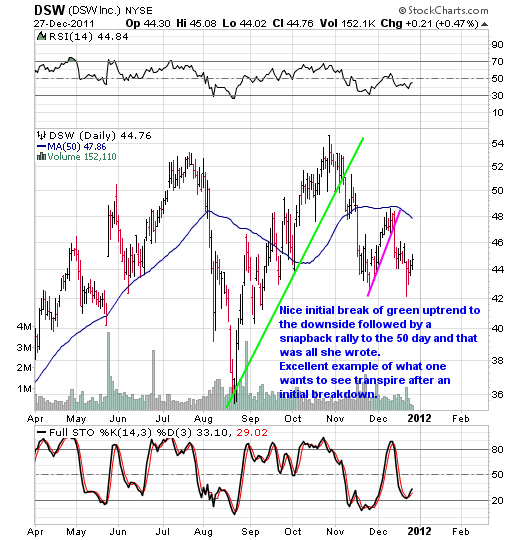
12-28 Sure enough, classic First Thrust Down, puts in a bear channel snapback rally (Pink) and now its bombs away. Keep in mind that bear channel is also a Pullback Off Lows (POL) , in down trending markets its the only pattern you’ll ever need to know.
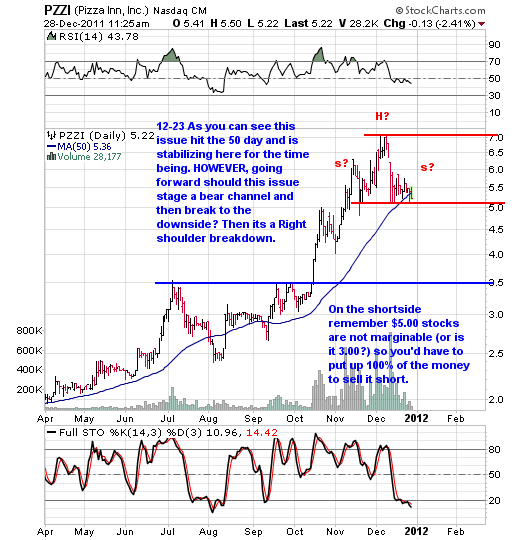
PZZI
12-28 I think we’ll delete this name after today as there are a lot of new names coming on line and we want to make room for them. Remember THAT is how the markets talk to us- All in chart pattern form.
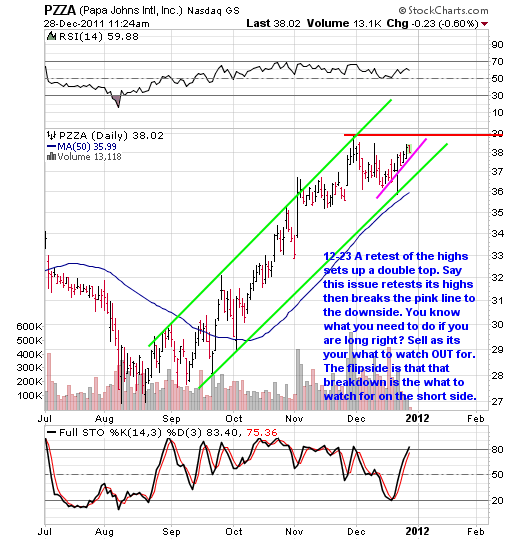
PZZA
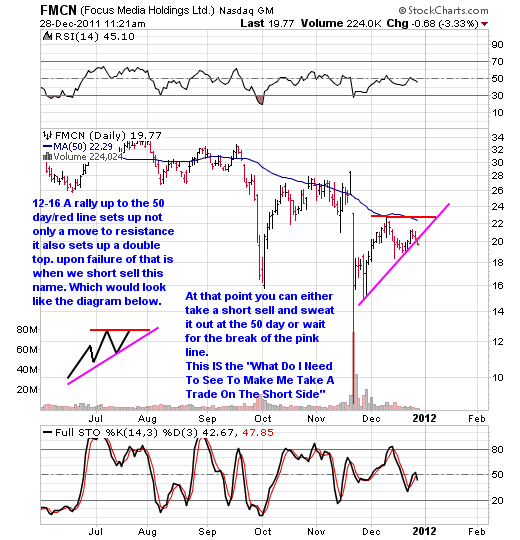
FMCN
12-28 Here is to hoping we see an E wave show up in the inverse index micro charts shown in the ETF section, if so we MIGHT get a bit of a lift then we can short it.
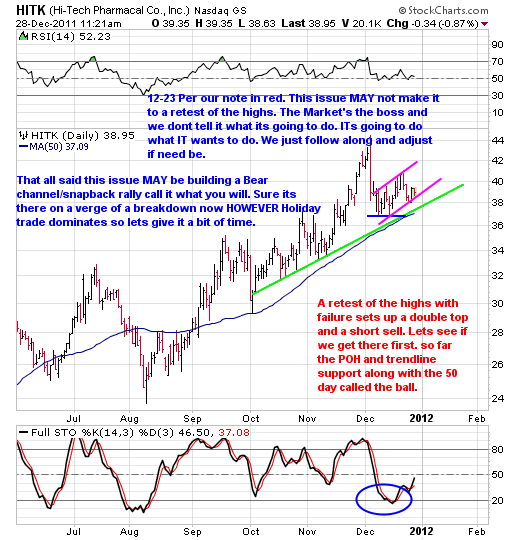
HITK
12-28 A retest of the 41 level highs with failure MAY end up being a mini double top. THEN we get interested more so than we currently are. That is the "What We’d Like To See" notice I said like? Market’s the boss not us.
INVERSE INDEX ETFs (For SHORT SIDE EXPOSURE FOR THOSE WHO CAN’T SHORT )
Many of you know all about these and play them often. For those of you new to the world of inverse index ETFs keep in mind that buying these is the equivalent of having short exposure via the indexes be it hedging long positions that you have owned since time began or to use as an opportunity to profit from. For those of you with IRAs and those who don’t short sell these are basically the only way you can gain short exposure in a down trending market. It’s really simple with these. Market up? These down. Market down? These up.
LEVERAGE
There are three types of these when it comes to market risk.
One time market risk – Market goes up one percent these typically go down one percent. Market goes down one percent these go up one percent.
Two times market risk – Market goes up one percent, these go down TWO percent. Market down one percent, these go up two percent.
Three times market risk- Market goes up one percent , these go down THREE percent. Market down one percent , these go up three percent.
Keep in mind there is slippage and it’s not an exact but dang close. One can also go to proshares.com for a listing of all the choices one has. For now we’ll stick with the two times market risk names of SDS (Inverse times 2 of SPX) and QID (Inverse of NDX 100 times 2). There are tons of these ETFs out there and we’ll consider adding others to this list as time goes on.
These are names we are WATCHING not doing currently. All because we want to be prepared in advance.
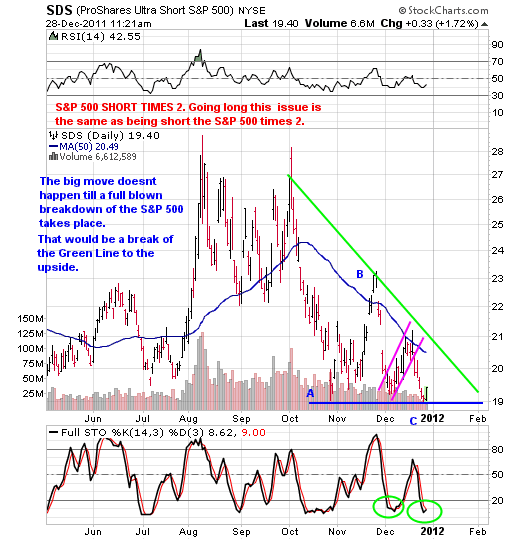
SDS – This is the INVERSE of the S&P 500 IndexTIMES TWO . The S&P 500 goes up, this goes down and vice versa.
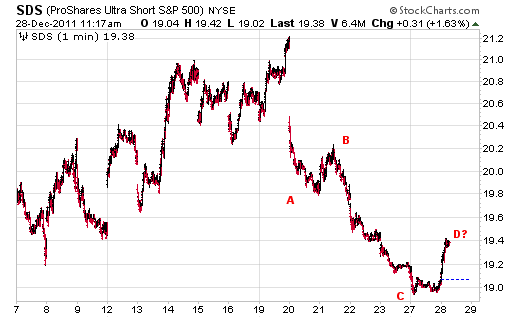
12-28 Hmmmm IF we see an E wave that ends up being a retest of these recent lows (which is a retest of the highs on the SPX) and then stabilization we’ll want to get serious about taking a piece of this name. Same goes for all the other indexes that look like this.
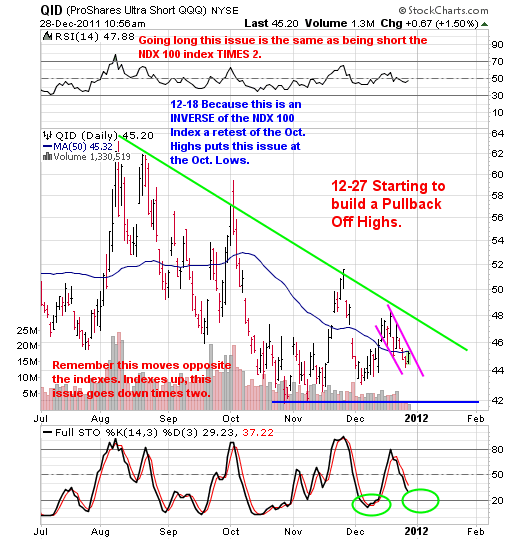
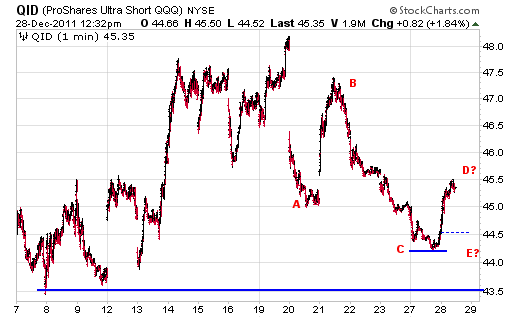
QID- This is the INVERSE of the NDX 100 Index TIMES TWO. The NDX goes up, this goes down and vice versa.
12-28 NOTE: Below every daily chart are the short term charts that zoom in on all the action off of the December highs in the daily charts. The QID chart has the action in the pink lines but the others do not. I ran out of time and will have them included in the mid day update tomorrow.
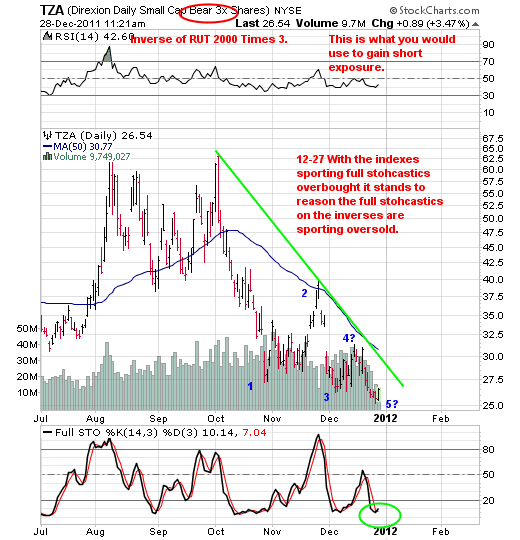
TZA- Inverse of the Russel 2000 Times Three
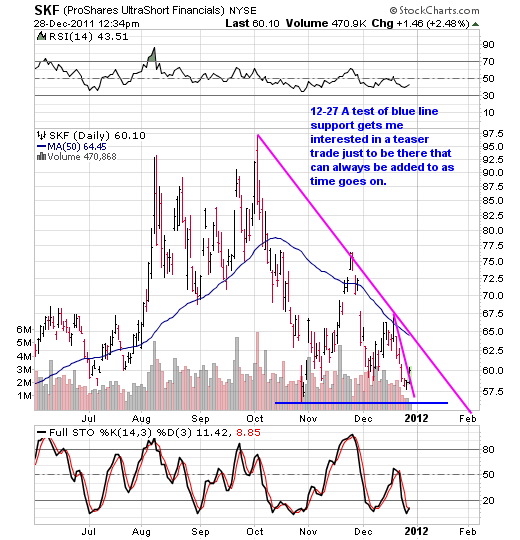
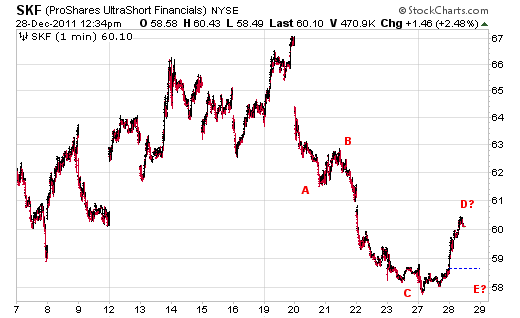
SKF
NEW NAME
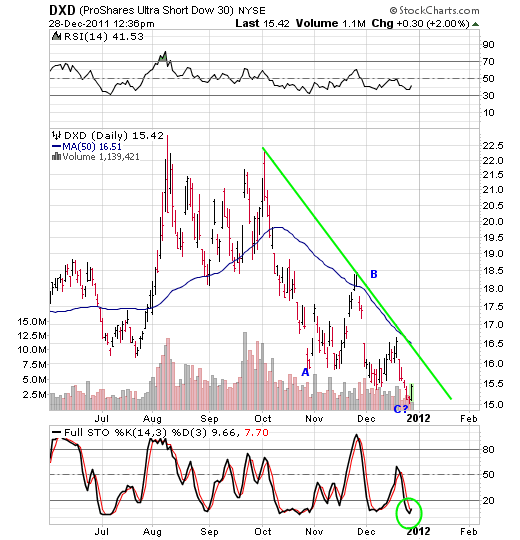
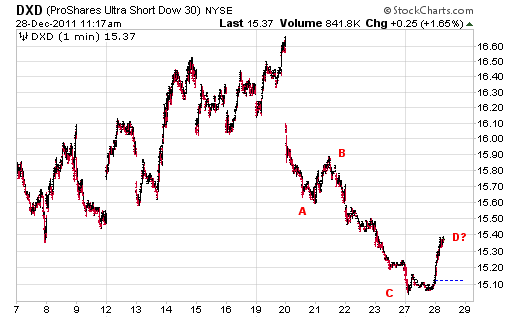
DXD- Inverse of Dow Industrials times two
NEW NAME
12-28 So in a nutshell, IF IF IF the markets retest the October highs and these are sitting at the lows (A micro E wave as shown in a lot of these micro charts?) we might just start to pick off a piece to "Be There" and sweat it out a bit. After all we’ve seen time and time again where these markets can spin on a dime in the opposite direction all in the form of a gap. If you aren’t there ahead of that you miss the gains from the gap. This goes both ways by the way.
For now we watch and get acquainted.
==================================================
LONG SIDE WATCH LIST
"Only The Best And Forget The Rest "
"We Trade What We SEE, NOT What We Think, Hear Or Fear "
12-28 NONE
Unless you want to count all the inverse index ETF’s but going long those are actually being short the market.
==================================================
"Let Your Stocks Tell You What To Do By The Action They Exhibit"
NOT YOUR EMOTIONS!
12-27 We’ll probably want to walk away on all of these as we get closer to the end of the week and end of the year for that matter. We really want to focus upon what the markets are currently telling us to focus upon and that is the shortside as evidenced by all the short sell patterns and big picture macro pattern that is developing.
We’ll even want to consider nibbling on some small positions on the shortside so as to "Be There" by end of the week. But by all means take it easy on that side of the coin and lets take it one step at a time.
Remember the clock starts over one week from today. YOU need to start thinking of how are you going to accomplish your goals in 2012. We know how we’ll be doing it do you?
LONG SIDE POSITIONS
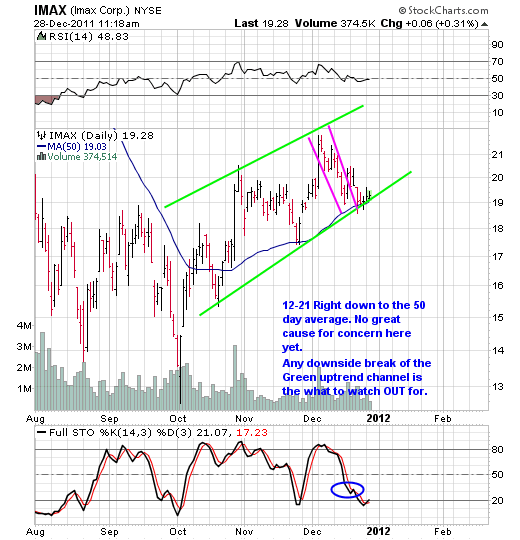
IMAX (We are long 300 shares of this at 20.10 as of 12-20-11)
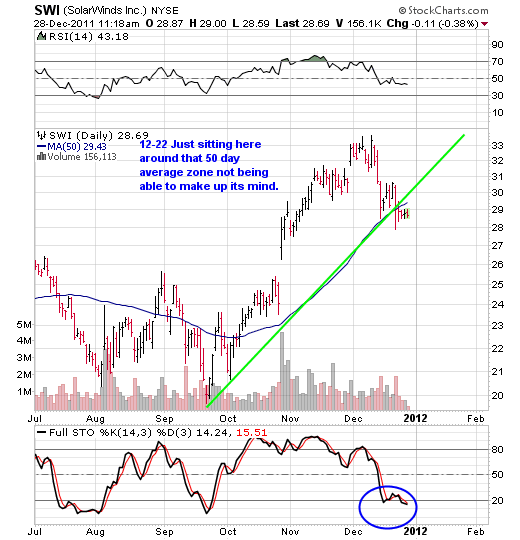
SWI (We are long 250 shares of this at 30.02 as of 12-20-11)
12-16 Hmmmm a retest of the lows from a few days ago with a launch off of it higher? (12-19That is the What to watch for) Sure that’s what we need to see. If that’s the case? It’s that micro 5th wave that would be in play. Market makes the call.
12-15 This name currently looks decent here. We doubt it retests it highs but for a hit and run? Let’s get to Friday afternoon first. The flip side to this that a bounce in this name could be just that, a bounce that sets up a right shoulder of a head and shoulders top or a bear channel, snapback rally just like SPRD did and then rolls over. So we really could be looking at two trades coming our way over the next few weeks with this one.
JOY (We are long 150 shares of this at 87.13 as of 12-13-11)
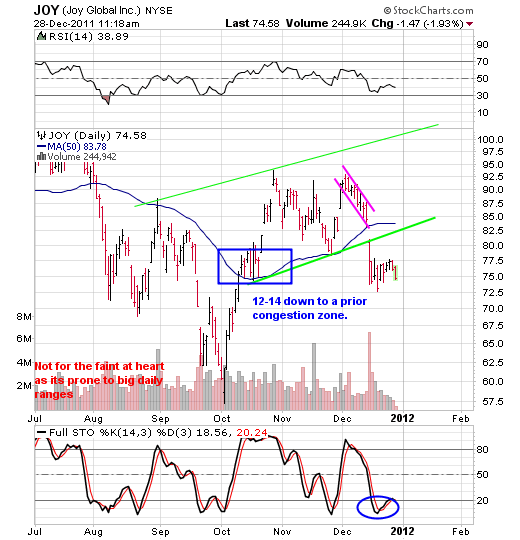
12-23 Just marking time, doesn’t want to break 74 but doesn’t want to break 77 ish higher either.
==================================================
To our NEW SUBSCRIBERS
What we’ve tried to do is break our watch list down into chart pattern recognition structure from a visual standpoint. Learn the patterns and the components of patterns and you’ll blow those Wall Street MBAs away. You don’t need a $3,000 software program either. All you need is a BURNING DESIRE to be the best that you can be and we’re here to help.
We have a lot of new folks here and we thank you! We want you to take it easy, get to know how the routine works around here for awhile and to feel comfortable.
We hope you all aren’t here because you are chasing performance. For us it’s more about educating and making you the best you that you can be first (that’s what we focus upon!). Like many of our long time subscribers they have all found out that they have no use for traditional Wall Street (and we don’t blame them) and it’s our hope that over time you’ll have acquired enough knowledge from us to say the same with conviction.
One of the most important things we want to stress is that of RISK MANAGEMENT via POSITION SIZING. You don’t need to stack your account with just a few big positions as we’ve seen it time and time again that those who get into trouble are the ones who take large positions and do not employ any risk management system IE shoot for the fences. Those are the people who live on the fringes of extremes and yes ultimately get burned.
As a guideline a good initial system is that of the following example.
Let’s say you have a $100,000 portfolio and let’s say that as a guide you never place more than 10% ($10,000) into any one position. Now let’s say that one day a news driven event hits (over which you have no control over anyway) and one of the positions tanks 20%. On its own that position is sporting a $2,000 loss, while that may seem devastating on its own its really no big deal overall.
Why? Simple its all about risk management being properly employed. What is the impact of a $2,000 loss to the TOTAL VALUE of the portfolio in this example.
Answer: A whopping 2% LOSS. Now you know why we say no big deal.
We can also tell you new people here that you will get stopped out of names and you will take hits. There is nobody on the planet living that has ever hit 18 holes in one and there never will be. We’d rather get you grounded in reality right away vs talking about pie in the sky all the time like a lot of other sites. In so doing your head is screwed on straight from the start and when those days happen (and they will) mentally it won’t mean a thing to you. To us that’s what’s most important is YOUR state of mind as it’s your most important asset. We hope you appreciate our honesty.
We have a very good retention rate here at All About Trends and a lot of great outstanding people here. We like to think that a part of that is being upfront about what can happen (in both directions). Verses those up 500%, I turned $50,000 into $3 million or some other absurd number to get you to bite. That’s not who we are.
WELCOME ABOARD!
==================================================
Lastly with regards to taking any trade:
Remember the moment you take a trade you are at the mercy of the market and have no control except when to sell. If you are not willing to take the risk and are not willing to pay that price do not take the trade. We are willing to take that risk knowing full well the end result could be a loss. That said make sure that portfolio management trade size is used accordingly. With any position you may take make sure that should something go awry the amount of total impact to your account does not devastate your acct. Try to stick to a 5% position That’s the key to portfolio management, not biting off more than you can chew.
Remember the mechanics of reality with regards to the stock market states a stock can only do one of three things: Up, Down, Nowhere. The moment you hit the enter button you are at the mercy of the market therefore the only control you have is when to sell/cover. You can’t manage your gains as you have none to manage initially. Knowing this in advance it allows you to stay in outcome, that being you will either:
1. Make a gain
2. Wash
3. Get stopped out at a loss
Remember the market IS the boss. IT is going to do what IT wants to do.
==================================================
OPTIONS — Your best friend and worst enemy
Let’s talk about options for a moment. First off this is a big universe with a lot of advanced strategies and terms like theta, delta , straddles, butterflies and the whole gambit. For the purposes of this conversation we’ll keep it real simple and not try to get to deep.
We’ll approach it from simple buy puts (short side) buy calls (long side). The first thing I want to mention is that options attract the fast money crowd in hopes of turning 500 into 10,000 overnight. This is also the get rich quick crowd. And more often than not these type of people get broke faster than they get rich. Please don’t be one of them as greed kills.
Time and time again we hear from people who like to trade options, and time and time again we hear the horror stories too. When we hear the horror stories nine times out of ten we can guess as to why their option went to zero. Nine times out of ten it was because they bought out of the money options or at the money options. This is the reason why 80% of those who do options lose money by the way.
Sure there are folks who use out of the monies and at the monies but those are experienced traders that know the ins outs ups and downs.
You see the trick is to NOT pay for time. You want as close to a point for point move as possible with the stock because there is nothing worse than seeing your stock move yet your option does nothing or very little, know the feeling?
So for All About Trends we only want to look at IN THE MONEY CALLS OR PUTS and we DO NOT WANT TO PAY FOR TIME, sure they cost more BUT we want to be as close as possible to being able to see a point for point move with the stock.
We hate paying for time. We want true value without the time. We’re not saying our way is any better than others, we’re just saying it’s what works for us.
Now let’s touch upon how we would build a portfolio dedicated to options and how to make it a piece of your overall portfolio via allocation. Keep in mind this is more geared towards beginners so you advanced people might be bored with it but then again it never hurts to revisit the basics every now and then.
At All About Trends Trends we talk a lot about never biting off more than you can chew and trade size position management. We do that for a reason, we do it so as to when Murphy’s law shows up it never devastates us or blows us up. Typically we try to stay within a 5-7% position size when we do a trade. The same thing goes for options. If we were to start a portfolio of options or shall we say allocate a portion of our overall portfolio to options the way we would look at it is the following:
For example, let’s say the total value of your portfolio is $100,000. The most we’d consider allocating towards an options strategy is 10% of the whole portfolio. In this case $10,000. So now you’d have a $10,000 option portfolio to work with. Now let’s say that you are the worst trader on the planet (we doubt that!) and you lose the whole option portfolio, what’s the risk to the total value of the overall portfolio? 10% in which case you live to play another day. Now let’s touch upon that $10,000 you allocated toward options. Let’s reduce the risk even further (and we haven’t even talked about what stocks to trade yet). Let’s take that $10,000 and split it up into no more than 10% ($1,000) can be allocated to anyone position as a guide. (Sometimes 1000 can get you 3-4 contracts you know). Now let’s say that one of those positions goes bust (and they will! and sometimes more than one at the same time we assure you.) What is the total impact to the overall options portfolio? 10% right?
Now let’s take that a step further. What’s the total impact to the overall investment portfolio of 100,000? 1% – that’s right 1 measly percent. When it comes to options you need to employ some sort of portfolio risk management structure parameters as this way you can get in trouble and you don’t lose sleep – you just have a bad day that’s all.
As for getting rich overnight? Forget about it. That’s just a marketing ploy. As for taking 50,000 and turning it into millions? Ain’t happening overnight but it sure sounds good doesn’t it? And that is why people bite on those marketing ploys.
As for time? We never go out months. As a swing trader we’re in positions for only a couple of weeks best case so why pay for the time to go out further in time when you don’t have to. When the stock moves whether it’s right away or not they sure seem to suck that time out of you just as fast anyway right?
Typically we’ll look at the front month (current month) or the next month but not months. When we say front month if options expiration is a week or sometimes even two weeks away we’ll look out to the next month and not the current. While time is our enemy in most cases, in this case it’s your friend. It’s just that you don’t want to pay for it.
==================================================
SUBSCRIBER ONLY WEB SITE
Don’t forget you can view updates in the middle and the end of each trading day complete with current charts, along with our current performance at our subscriber only web site. |