|
If I had to sum up the markets here I could do so in three words:
Backing And Filling
Remember how we’ve talked numerous times about how markets digest gains? sideways or down in corrective fashion vs impulsive action and that is what we go the last two days from the gap up on Tuesday.
Of course over the last hour its now trying to work its way higher which is fine by me. That corrective not really giving up the ghost is exactly why we havent taken any short sells or go long any inverse ETF’s for the tiime being.
Yesterday we said:
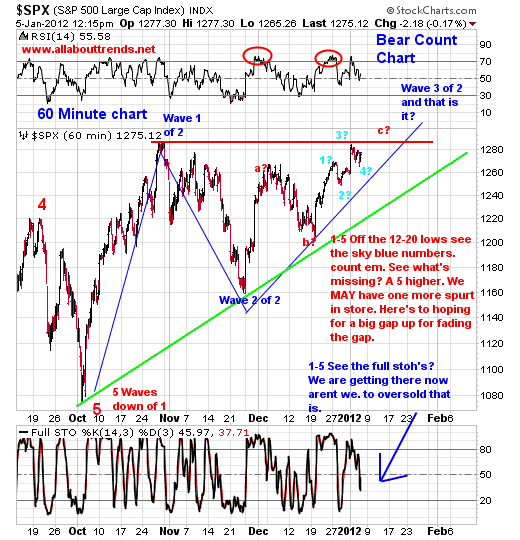
When I look at the daily charts right now all I’m seeing is a pullback that may fill the gap. In so doing it will reset the Full Stoh’s on the 60 minute charts.
Below is the S&P 500 chart in 60 minute time frequency.
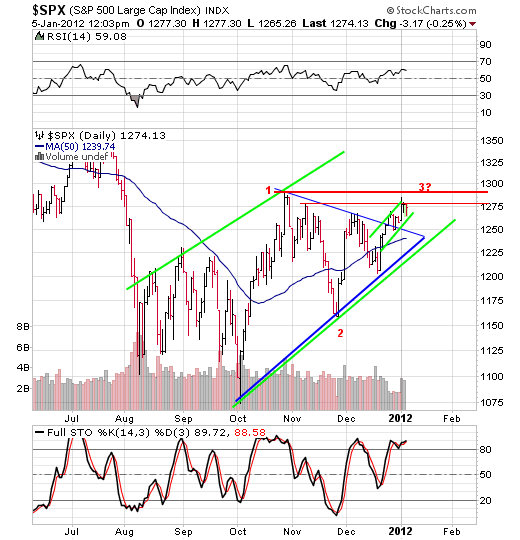
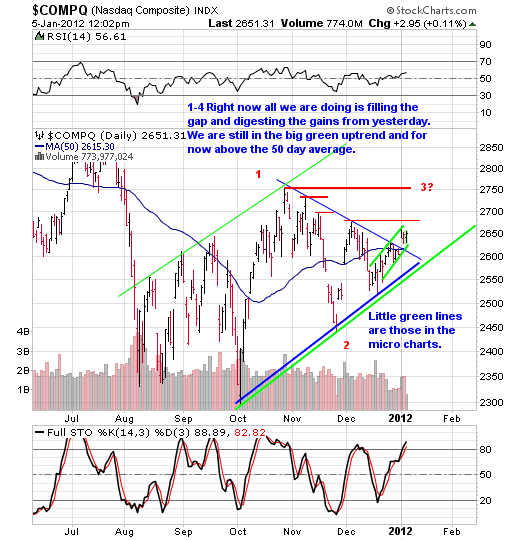
Below are the daily chart frequencies of the SPX and Comp.
1-5 Notice how both of these indexes never broke the small green channel lines to the downside? This is the short term channel we really want to pay attention to from here on out as it defines the current upswing.
OHH, as far as employment getting better the last two months? Well of course it was better, seasonal Christmas hiring- DUH. Not to mention those who fell off the statistics measurements. And what about those who lost jobs BUT were given one year severance packages, they aren’t included in the numbers now are they?
Lets see how January and February pan out shall we.
"What to watch for" and ‘What to watch out for" Example Chart Of the Day
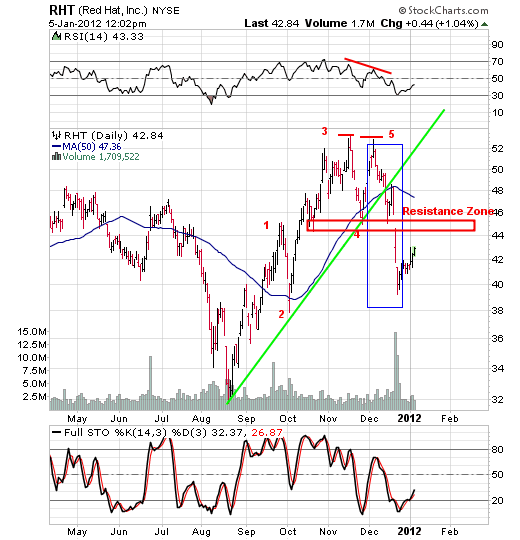
Hat Tip to Warren for this chart . Folks, what we have here is another thing of beauty much like the GLD example from a few days ago.
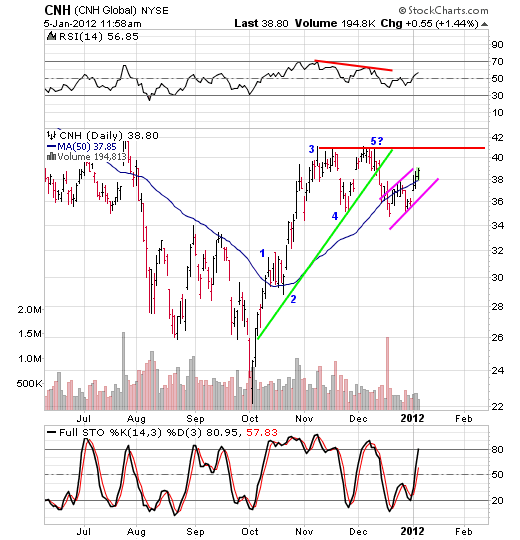
Lot going on in this chart. First off, Off the August lows you can clearly see the Pullbacks Off Highs (POH) longside triggers (the only pattern you ever need to know in uptrending markets and issues by the way) when this issue sold off to the 50 day average shown in the red numbers 2 and 4. Classic buy points for us.
Secondly notice the classic Elliott Wave five waves up off the August lows? Notice how it stalled out? Yep a Double Top on negative RS divergence. If you were long that was your "What to watch OUT for" If you were looking to sell short? It was the "What to watch for".
From The retest of the highs (red 5 ) the moment it started breaking back to the downside that was resistance players que to sell it short of course this was all to the dismay of the breakouts into new highs buyers. Again folks this isn’t the 90’s and bull market strategies don’t work in sloppy mature markets. So if you are wondering why you are getting thrown around when you buy breakouts into new highs now you know.
From the breakdown (Blue box 1st thrust down) this issue is now in a classic All About Trends snapback rally mode. how far it goes from here is another story but as you can see we’ve got a resistance zone just ahead and the 50 day average just ahead of that. After today this issue gets added to the Short side WATCH list.
In Summary:
A big change in trend comes WHEN we break to the downside of the big picture uptrend off the Oct. lows. That is a big trade and its on the short side. The other big trade is at MAJOR resistance (assuming we get there).
Big picture we are going to be in for some rough sledding at some point this year. BUT first we need to polish off this current run we are in.
The big question is? Will the SPX make it to 1292 resistance? Will it head fake and bust thru it and hit the MAJOR downtrend line at 1320?
I would not rule out a break over 1292 to stir up the emotional masses (in which case the masses will say See! an inverse head and shoulders bottom so lets buy buy buy) BUT first we need to digest this run from yesterday.
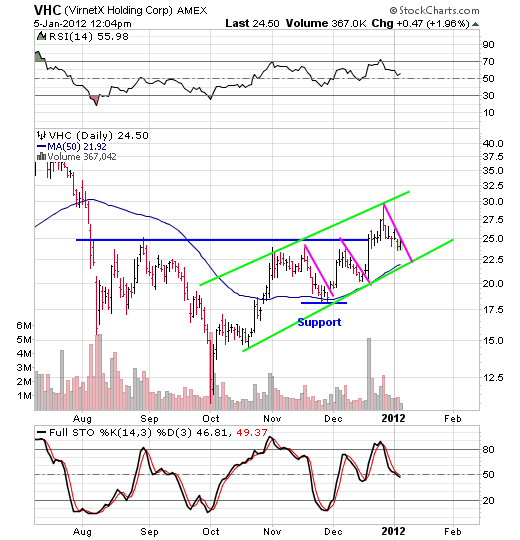
We’ll sit tight with our positions and continue to monitor the action here. If I were going to go long for a POTENTIAL one more pop to the upside as mentioned in the S&P 500 60 minute time frequency chart it would be in VHC and that would be for a trade. In fact don’t be surprised to see us issue a longside trade trigger on this stock (shown in longside watch list) shortly after this mid day update FOR A TRADE. Why just a trade? because this is NOT an investor’s market.
========================================================
SHORT SIDE WATCH LIST
12-28 From here on out we’ll want to get ourselves prepared for the short side. A lot of these are getting close. Any bounce from here in the market and we start nibbling to "Be There" and then sweat it out while in the zone.
See how big this list is getting? That ought to tell you something.
"WHAT DO I NEED TO SEE TO MAKE ME TAKE A TRADE ON THE SHORT SIDE "
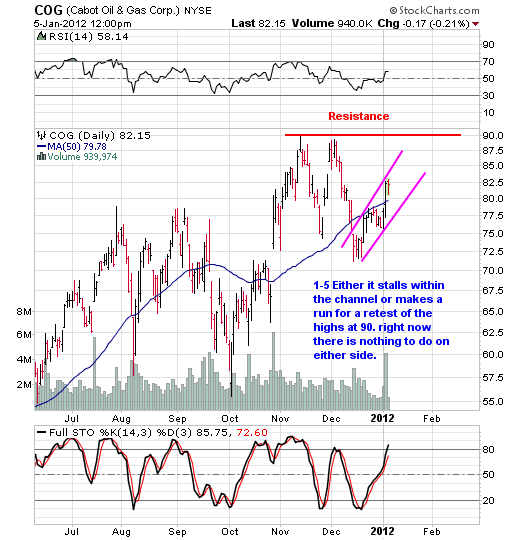
COG
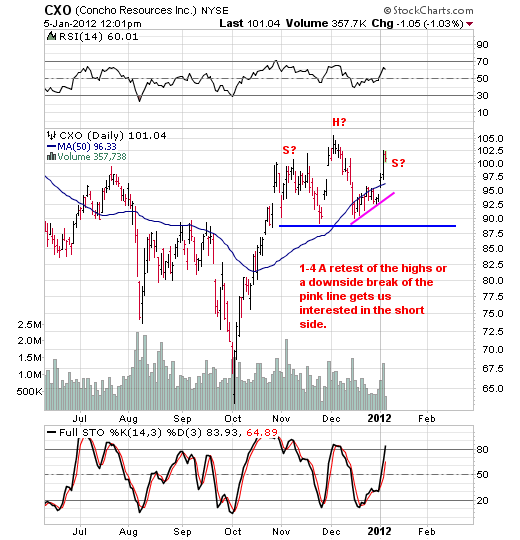
CXO
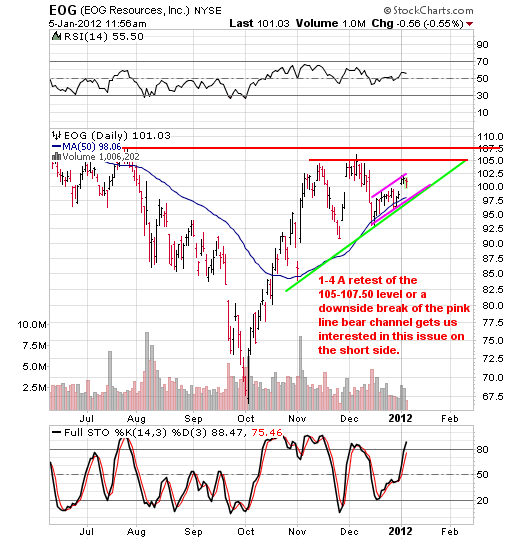
EOG
1-5 A downside break of the pink lines are a sell short trigger or a retest of the highs is a short sell trigger. As you can see neither is taking place today.
1-4 The only thing I don’t like about shorting energy is geopolitical risk. but come to think of it, that has always been hanging over our head since time began.
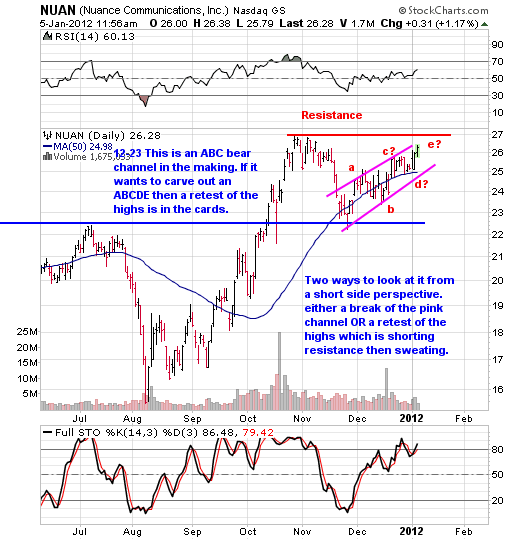
NUAN
1-5 As you can see the this issue is getting near a retest of the highs. The breakout buyers are going to start salivating now aren’t they. Well sure MAYBE they get a little pop into a new high BUT more often than not most fail shortly there after. Be aware of that if you are a breakout buyer. They don’t call breakouts into new highs in this climate shake and bakes for nothing you know. Come to think of it, anyone see MA lately? its looking like RHT did just as it started first thrusting down. Just saying.
CNH
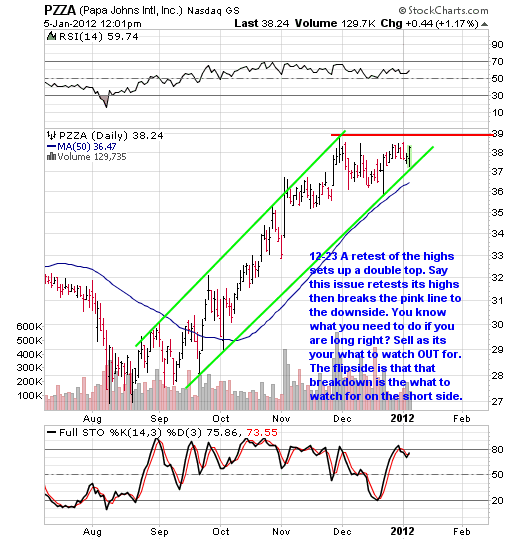
PZZA
12-30 Well this one sure is getting that nice uptrend and putting in a potential double top look to it if you ask me. Let’s see if this issue can break out into a new high and stage a shake and bake fake out for those who like to get hammered buying breakouts.
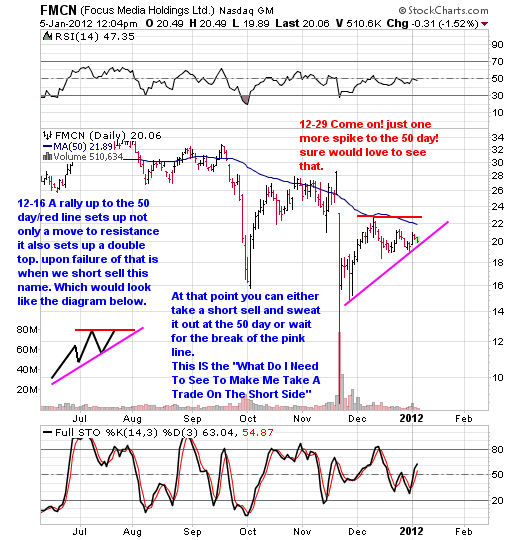
FMCN
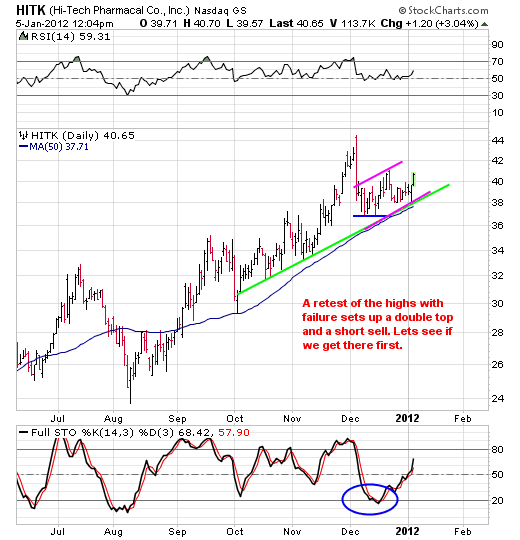
HITK
12-28 A retest of the 41 level highs with failure MAY end up being a mini double top. THEN we get interested more so than we currently are. That is the "What We’d Like To See" notice I said like? Market’s the boss not us.
INVERSE INDEX ETFs (For SHORT SIDE EXPOSURE FOR THOSE WHO CAN’T SHORT )
12-29 NOTE: By popular demand we are going to launch a new model portfolio strictly dedicated to ETF’s . It will start with a tracking value of 100,000 and will kick off with the first ETF trades that we trade trigger and will be tracked separately for performance purposes.
Many of you know all about these and play them often. For those of you new to the world of inverse index ETFs keep in mind that buying these is the equivalent of having short exposure via the indexes be it hedging long positions that you have owned since time began or to use as an opportunity to profit from. For those of you with IRAs and those who don’t short sell these are basically the only way you can gain short exposure in a down trending market. It’s really simple with these. Market up? These down. Market down? These up.
LEVERAGE
There are three types of these when it comes to market risk.
One time market risk – Market goes up one percent these typically go down one percent. Market goes down one percent these go up one percent.
Two times market risk – Market goes up one percent, these go down TWO percent. Market down one percent, these go up two percent.
Three times market risk- Market goes up one percent , these go down THREE percent. Market down one percent , these go up three percent.
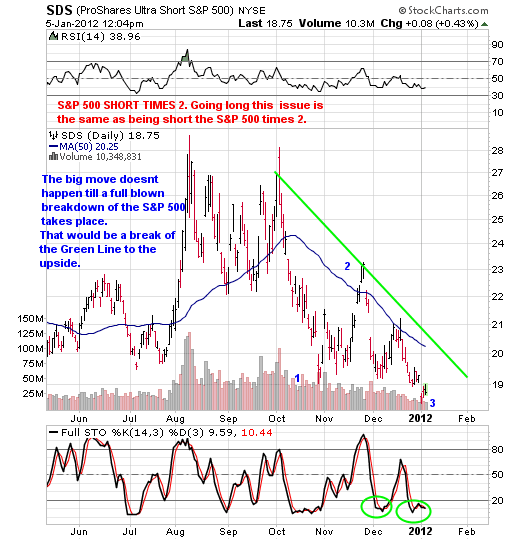
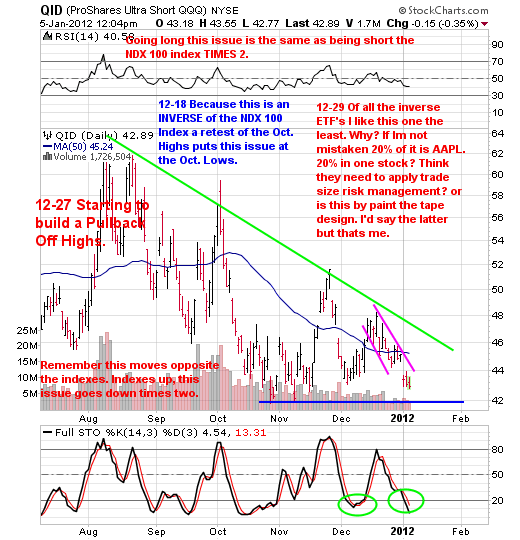
Keep in mind there is slippage and it’s not an exact but dang close. One can also go to proshares.com for a listing of all the choices one has. For now we’ll stick with the two times market risk names of SDS (Inverse times 2 of SPX) and QID (Inverse of NDX 100 times 2). There are tons of these ETFs out there and we’ll consider adding others to this list as time goes on.
These are names we are WATCHING not doing currently. All because we want to be prepared in advance.
SDS – This is the INVERSE of the S&P 500 Index TIMES TWO . The S&P 500 goes up, this goes down and vice versa.
QID — This is the INVERSE of the NDX 100 Index TIMES TWO. The NDX goes up, this goes down and vice versa.
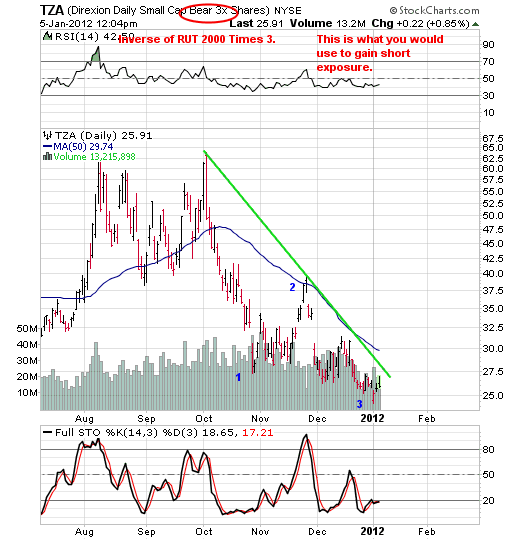
TZA — Inverse of the Russel 2000 Times Three
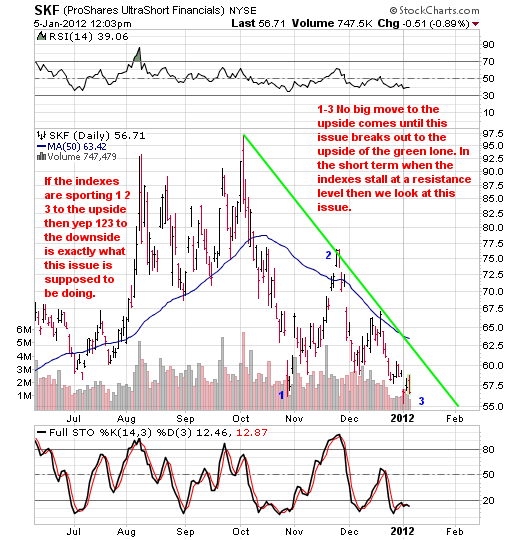
SKF
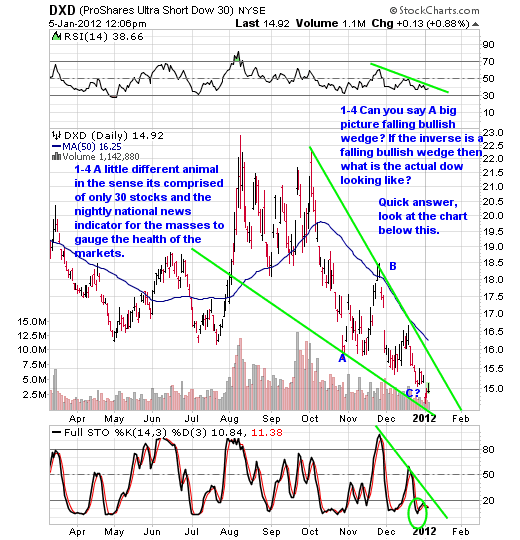
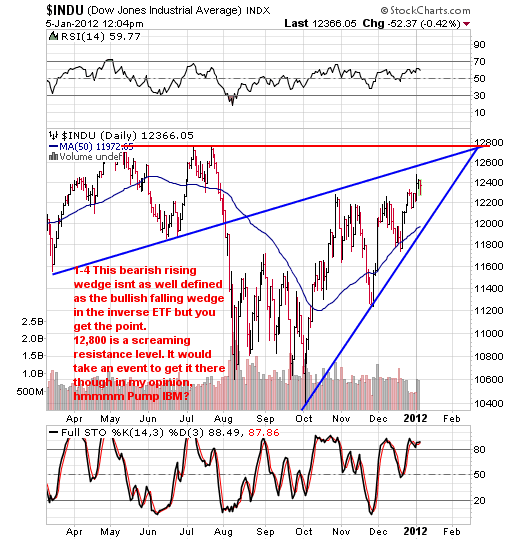
DXD — Inverse of Dow Industrials times two
12-28 So in a nutshell, IF IF IF the markets retest the October highs and these are sitting at the lows we might just start to pick off a piece to "Be There" and sweat it out a bit. After all we’ve seen time and time again where these markets can spin on a dime in the opposite direction all in the form of a gap. If you aren’t there ahead of that you miss the gains from the gap. This goes both ways by the way.
For now we watch and get acquainted.
==================================================
LONG SIDE WATCH LIST
"Only The Best And Forget The Rest "
"We Trade What We SEE, NOT What We Think, Hear Or Fear "
1-5-12
VHC
As you can see its in a clearly defined uptrend and yes again its Pulling back Off Highs (POH). There are two ways to look at it. Wait for the break to the upside to pick some off or right here and sweat it out till it moves if it moves.
==================================================
"Let Your Stocks Tell You What To Do By The Action They Exhibit"
NOT YOUR EMOTIONS!
LONG SIDE POSITIONS
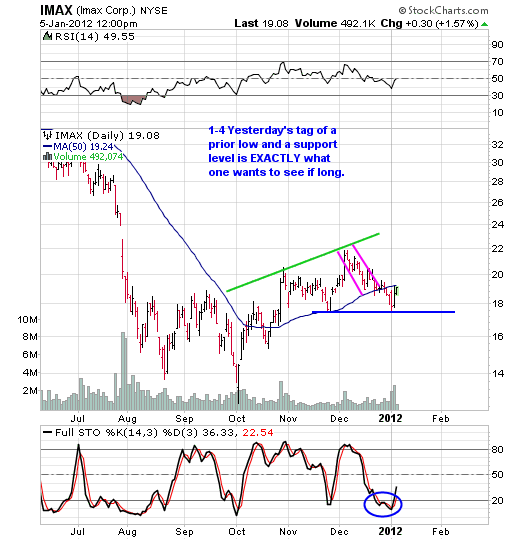
IMAX (We are long 300 shares of this at 20.10 as of 12-20-11)
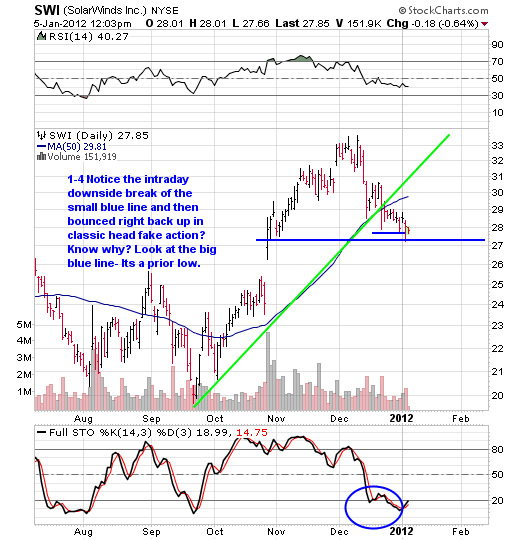
SWI (We are long 250 shares of this at 30.02 as of 12-20-11)
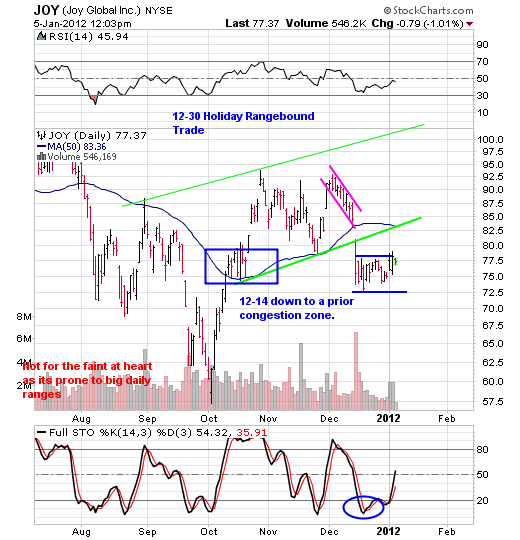
JOY (We are long 150 shares of this at 87.13 as of 12-13-11)
1-4 Trying to break out of the trading range to the upside here.
12-23 Just marking time, doesn’t want to break 74 but doesn’t want to break 77 ish higher either.
==================================================
To our NEW SUBSCRIBERS
What we’ve tried to do is break our watch list down into chart pattern recognition structure from a visual standpoint. Learn the patterns and the components of patterns and you’ll blow those Wall Street MBAs away. You don’t need a $3,000 software program either. All you need is a BURNING DESIRE to be the best that you can be and we’re here to help.
We have a lot of new folks here and we thank you! We want you to take it easy, get to know how the routine works around here for awhile and to feel comfortable.
We hope you all aren’t here because you are chasing performance. For us it’s more about educating and making you the best you that you can be first (that’s what we focus upon!). Like many of our long time subscribers they have all found out that they have no use for traditional Wall Street (and we don’t blame them) and it’s our hope that over time you’ll have acquired enough knowledge from us to say the same with conviction.
One of the most important things we want to stress is that of RISK MANAGEMENT via POSITION SIZING. You don’t need to stack your account with just a few big positions as we’ve seen it time and time again that those who get into trouble are the ones who take large positions and do not employ any risk management system IE shoot for the fences. Those are the people who live on the fringes of extremes and yes ultimately get burned.
As a guideline a good initial system is that of the following example.
Let’s say you have a $100,000 portfolio and let’s say that as a guide you never place more than 10% ($10,000) into any one position. Now let’s say that one day a news driven event hits (over which you have no control over anyway) and one of the positions tanks 20%. On its own that position is sporting a $2,000 loss, while that may seem devastating on its own its really no big deal overall.
Why? Simple its all about risk management being properly employed. What is the impact of a $2,000 loss to the TOTAL VALUE of the portfolio in this example.
Answer: A whopping 2% LOSS. Now you know why we say no big deal.
We can also tell you new people here that you will get stopped out of names and you will take hits. There is nobody on the planet living that has ever hit 18 holes in one and there never will be. We’d rather get you grounded in reality right away vs talking about pie in the sky all the time like a lot of other sites. In so doing your head is screwed on straight from the start and when those days happen (and they will) mentally it won’t mean a thing to you. To us that’s what’s most important is YOUR state of mind as it’s your most important asset. We hope you appreciate our honesty.
We have a very good retention rate here at All About Trends and a lot of great outstanding people here. We like to think that a part of that is being upfront about what can happen (in both directions). Verses those up 500%, I turned $50,000 into $3 million or some other absurd number to get you to bite. That’s not who we are.
WELCOME ABOARD!
==================================================
Lastly with regards to taking any trade:
Remember the moment you take a trade you are at the mercy of the market and have no control except when to sell. If you are not willing to take the risk and are not willing to pay that price do not take the trade. We are willing to take that risk knowing full well the end result could be a loss. That said make sure that portfolio management trade size is used accordingly. With any position you may take make sure that should something go awry the amount of total impact to your account does not devastate your acct. Try to stick to a 5% position That’s the key to portfolio management, not biting off more than you can chew.
Remember the mechanics of reality with regards to the stock market states a stock can only do one of three things: Up, Down, Nowhere. The moment you hit the enter button you are at the mercy of the market therefore the only control you have is when to sell/cover. You can’t manage your gains as you have none to manage initially. Knowing this in advance it allows you to stay in outcome, that being you will either:
1. Make a gain
2. Wash
3. Get stopped out at a loss
Remember the market IS the boss. IT is going to do what IT wants to do.
==================================================
OPTIONS — Your best friend and worst enemy
Let’s talk about options for a moment. First off this is a big universe with a lot of advanced strategies and terms like theta, delta , straddles, butterflies and the whole gambit. For the purposes of this conversation we’ll keep it real simple and not try to get to deep.
We’ll approach it from simple buy puts (short side) buy calls (long side). The first thing I want to mention is that options attract the fast money crowd in hopes of turning 500 into 10,000 overnight. This is also the get rich quick crowd. And more often than not these type of people get broke faster than they get rich. Please don’t be one of them as greed kills.
Time and time again we hear from people who like to trade options, and time and time again we hear the horror stories too. When we hear the horror stories nine times out of ten we can guess as to why their option went to zero. Nine times out of ten it was because they bought out of the money options or at the money options. This is the reason why 80% of those who do options lose money by the way.
Sure there are folks who use out of the monies and at the monies but those are experienced traders that know the ins outs ups and downs.
You see the trick is to NOT pay for time. You want as close to a point for point move as possible with the stock because there is nothing worse than seeing your stock move yet your option does nothing or very little, know the feeling?
So for All About Trends we only want to look at IN THE MONEY CALLS OR PUTS and we DO NOT WANT TO PAY FOR TIME, sure they cost more BUT we want to be as close as possible to being able to see a point for point move with the stock.
We hate paying for time. We want true value without the time. We’re not saying our way is any better than others, we’re just saying it’s what works for us.
Now let’s touch upon how we would build a portfolio dedicated to options and how to make it a piece of your overall portfolio via allocation. Keep in mind this is more geared towards beginners so you advanced people might be bored with it but then again it never hurts to revisit the basics every now and then.
At All About Trends Trends we talk a lot about never biting off more than you can chew and trade size position management. We do that for a reason, we do it so as to when Murphy’s law shows up it never devastates us or blows us up. Typically we try to stay within a 5-7% position size when we do a trade. The same thing goes for options. If we were to start a portfolio of options or shall we say allocate a portion of our overall portfolio to options the way we would look at it is the following:
For example, let’s say the total value of your portfolio is $100,000. The most we’d consider allocating towards an options strategy is 10% of the whole portfolio. In this case $10,000. So now you’d have a $10,000 option portfolio to work with. Now let’s say that you are the worst trader on the planet (we doubt that!) and you lose the whole option portfolio, what’s the risk to the total value of the overall portfolio? 10% in which case you live to play another day. Now let’s touch upon that $10,000 you allocated toward options. Let’s reduce the risk even further (and we haven’t even talked about what stocks to trade yet). Let’s take that $10,000 and split it up into no more than 10% ($1,000) can be allocated to anyone position as a guide. (Sometimes 1000 can get you 3-4 contracts you know). Now let’s say that one of those positions goes bust (and they will! and sometimes more than one at the same time we assure you.) What is the total impact to the overall options portfolio? 10% right?
Now let’s take that a step further. What’s the total impact to the overall investment portfolio of 100,000? 1% – that’s right 1 measly percent. When it comes to options you need to employ some sort of portfolio risk management structure parameters as this way you can get in trouble and you don’t lose sleep – you just have a bad day that’s all.
As for getting rich overnight? Forget about it. That’s just a marketing ploy. As for taking 50,000 and turning it into millions? Ain’t happening overnight but it sure sounds good doesn’t it? And that is why people bite on those marketing ploys.
As for time? We never go out months. As a swing trader we’re in positions for only a couple of weeks best case so why pay for the time to go out further in time when you don’t have to. When the stock moves whether it’s right away or not they sure seem to suck that time out of you just as fast anyway right?
Typically we’ll look at the front month (current month) or the next month but not months. When we say front month if options expiration is a week or sometimes even two weeks away we’ll look out to the next month and not the current. While time is our enemy in most cases, in this case it’s your friend. It’s just that you don’t want to pay for it.
==================================================
SUBSCRIBER ONLY WEB SITE
Don’t forget you can view updates in the middle and the end of each trading day complete with current charts, along with our current performance at our subscriber only web site.
|

