

It's been 3 years since the big crash.
In all that time, we have not had to adjust our Big Chart, which is based on our 5% Rule and has steered us well through the recovery. Now that we are all the way back to our pre-crash highs, it's time, finally, to make a more bullish adjustment. We will be changing our long-standing +10% line at 1,359 to the new Must Hold line at 1,360 – one point off from our original estimate after gathering 36 months of additional years of evidence.
.jpg)
That's right, it turns out our +10% line is still pretty much right on the money, only now we switch our focus to our goal of 1,600 and begin running our numbers off there, rather than from 800. I know I have been (and still am) Fundamentally bearish on the market at the moment – I just think we are making this move too soon – but that is not to say I think the move is unmakeable.
 As noted in the Chart, other than overshooting the 50% line in early 2010, we had very predictable moves all the way through last week but, in retrospect, we may just be looking at phase 3 of the move back to 1,500. As long as we are over 1,280 now (20% off the top) we will remain in the bullish range and that means we have higher expectations for our indices so our next goal is 1,440, 10% off the top.
After all, if we're going to be bullish, then our goals should reflect it, right? That makes our new series for the S&P on our Big Chart -20% at 1,280, our must hold line at 1,360, -10% at 1,440 and -5% at 1,520. If we fail to hold the Must Hold line and especially if we fail 1,280, we revert back to the prior Big Chart numbers, where the calculations were made off the bottom. It's like Gravity, as we get closer to 1,600 – it begins to exert more influence. We can also expect the 2.5% lines to become more prominent, as those were 5% lines off 800 and still will probably provide good resistance. This is why you see slowdowns and consolidations as you get near major moves like 100% off the bottom – various Bot programs using different base-lines begin to cause a squeeze as their programs overlap.
 My bad, by the way, for not realizing last fall that the bottom put in at 1,120 (40% up from 800), was also 30% below 1,600 – it was at that point that we could have been brave enough to flip the chart, or at least done so when we crossed -20% at 1,280. We were even bullish at the time with our August 27th "September's Dozen" and our extremely bullish "White Christmas Portfolio" along with our always bullish "Income Portfolio" – so it would have been a good idea to shift our charts to reflect that. Well, lesson learned (as long as you remind me next time).
As we had almost a 2 year's consolidation around 1,120, I think we should look at the run to 1,400 (25%) in that context and no longer look for the big pullback from the 600-point run from 800 (75%), where we'd expect a 20% (of the run) retrace back to 1,200. If we want to be bullish, then we should say a firm floor was put in at 1,120 and that means we should not pull back more than 56 points of our 280-point move (1,344). That's perfect then as our Must Hold line just so happens to be 1,360 so things are all lining up very nicely!
The S&P has, on the whole, literally gone nowhere for 5 years. We are right back to where we were in March of 2007. The Dow, on the other hand, is up almost 10% BUT, the Dow is not at all the same Dow as it as back then with MO and HON thrown out for BAC and CVX in Feb of 2008, AIG replaced by KFT in Sept 2008 and C and GM replaced by CSCO and TRV in June 2009. Wow, talk about market manipulation!

Other than HON, the Dow substitutions had a clear and profound impact on the average and that's going to make it very tricky to recalculate. Obviously, our old goal of of 14,000 is out the window (and GM and C were the anchors that were holding the Dow down when we first calculated our levels) so we'll have to AT LEAST add CSCO ($20) and TRV ($60) and multiply them by $8 in the price-weighted Dow for 640 more points but we have to respect CVX ($110) and KFT ($38) as well.
 AIG was reverse-split and is actually $1.40 (1/20th) and GM did something (I don't remember what) and C did a reverse so you have to compare the entire 1,900 points contributed by the 5 subs to the 800 points that can be accounted for from MO ($30) HON ($60) and AIG in the old Dow which brings us up to at least 15,000 but we've also removed the drag of the losers and we have a weaker Dollar so let's call it 16,000 to match up with the S&P (sorry, it's not an exact science!).
That, then, means the Dow is LAGGING the S&P in getting to goal, which makes sense because of something the S&P has that the Dow doesn't – AAPL! AAPL alone has boosted the earnings of the entire S&P 500 by 5%. Add that to the phony loan loss reserve reversals that have added tens of Billions to bank earnings and we can see why the S&P is off to the races. BAC (our One Stock to Buy for 2012) is also off to the races for the Dow, but going up 100% from $5 only adds 40 points to the Dow.
That, then, makes our Dow chart the same as the S&P chart x 10. It does place the Dow, at 13,232 just below the new Must Hold line at 13,600 but again, if we're going to be bullish – we need to challenge ourselves, don't we? On to the Nasdaq: The Nasdaq is pointless. AAPL has ruined it as has their recent re-weighting, which means we can't even compare the old Nasdaq to the new anymore. Still, 1,500 was clearly a 15-year base and it's not so much that 3,000 held up – as we only just popped it, but 2,700 (10% off) was a very good breakout/consolidation point since we failed it in early 2010.

Nothing too complicated here except it's quite possible that the Must Hold should be 2,850, not 3,000 but I'm assuming AAPL stays up and we have to weight the index up based on that.
 The NYSE, on the other hand and as I mentioned last week, is a serious lagger. They were over 10,000 in late 2007 and fell all the way to 4,000 in 2009 but we can certainly make a good case for 5,000 being consolidation and therefore 7,500 is the very significant 50% line up and check, that was huge consolidation and then, once we're over that, we flip the chart to negatives off 10,000 and we'll call our new Must Hold 8,000 (-20% from top) and then each 500 points is a 5% line on our bullish climb.
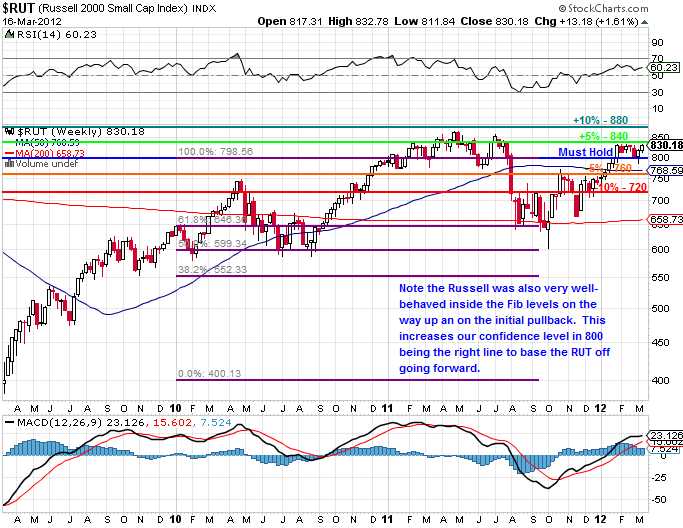
That leaves us with the Russell and our small cap index has made a nice double off 400 and 600 was good support along the way so 800 it is and that will be our Must Hold now so we've got 40s in each direction for progress and now it makes a lot more sense why we have this resistance at 840 and why 760 was a tough nut to crack. It will be very telling whether the current consolidation between 800 and 840 ends up breaking up or down from here:
So these are our new 5% Rule Charts and levels. If we're going to stay bullish, we expect a very nice move up from here and that means we can begin looking at aggressively bullish plays that we can simply stop out if we fail to hold our Must Hold lines (3 or 5 usually is good to confirm).
For example, we expect the S&P to work it's way up to 1,600 and that's SPY $160 and the Jan $146/154 bull call spread is $3 and you can sell the $110 puts for $3.15 so a .15 credit on the $8 spread and all we need is that 1,550 that everyone is predicting to make 5,433% on cash. TOS says the margin on the short $110 puts is net $11 so a very nice return on cash too – if it works. As we can stop out the spread at $2, it's worth our while as long as we don't believe the S&P will fail 1,100 this year.
 XLF should also fly if we make it through this quarter without slipping into another financial crisis. The Jan $13/16 bull call spread is $2 and you make 50% in 10 months on that just by getting it right. You can also sell JPM Jan $30 puts for $1 to knock the net down to $1 and making it a 200% potential upside or sell the JPM 2014 $28 puts for $2.10 and get a net .10 credit and a 3,100% upside potential gain on cash. TOS says the short JPMs are $2.60 in margin so 10 of those short for net $2,600 in margin drops $2,100 in cash in your pocket and then you buy the Jan bull call spread for $2K and your upside potential is $3,100 at XLF $16 and worst case is you own 1,000 JPM for net $27.90 (37% off). These are the kind of plays where – if you don't like them – you're just not bullish!
I'm still not really in the bullish spirit of things but I'm also not going to fight the Global Feds – too much money being thrown at the markets and already we're seeing signs of massive inflation kicking in. Once we hit the inflationary cycle, then game over and it's Dow 20,000 time and we'd BETTER be invested then or we're going to watch our buying power rapidly fall away.
We'll see how the week goes but we do need 10 more bullish plays as we used up the last batch already – more on that tomorrow.