

Reminder: Sabrient is available to chat with Members, comments are found below each post.
Courtesy of Sabrient Systems and Gradient Analytics
U.S. equities continue to shrug off worrisome global economics and the doomsday prognostications. The Dow, S&P 500, and Nasdaq are now all above psychological resistance levels of 13,000, 1400, and 3,000, respectively. Even Europe and China have seen a sustained bounce in equities. But everyone is wondering, how long can this continue given the dicey global economic situation?
Right now the large-cap S&P 500 indicates an earnings yield of over 7%–which reflects a historically high risk premium when compared to the 10-year Treasury yield—and an average dividend yield of approximately 2.2%. This could be shaping up to be a historic buying opportunity.
So, if Europe can stave off a sovereign debt and banking system catastrophe, we should continue to see capital flow into equities (even if in fits and starts), particularly U.S. stocks. In fact, the late-July rally led by defensive sectors like Utilities, Consumer Staples, and Healthcare, rather than a fearful flight to safety and a bearish development, actually might be simply an early-stage flight to higher income dividend payers.
Besides the ongoing uncertainty in Europe, lack of jobs growth continues to weigh heavily on investor psyches. The Bureau of Labor Statistics measures unemployment in a variety of ways, and their metrics are designated U1 through U6. U3 is the official unemployment rate that gets widely reported, which is the proportion of the civilian labor force that is unemployed and actively seeking employment. However, U6 is a bigger-picture view that adds in "discouraged workers" (who have given up on finding work), plus "marginally attached workers” (who are able to work but have not been looking recently), plus part-time workers who would prefer to be employed full time.
U3 is now at 8.3%, as we all know. It was around 4% at the beginning of the century. U6 for July came in at 15.0%, which is also up-trending slightly from April’s 14.5%. It was around 7% at the start of the century. U6 is probably more reflective of the average American’s perception. The highest recent U6 reading was in October 2009 at 17.2%.
Looking at the SPY chart, it closed Wednesday at 140.49 and has been trading since mid-May within a very clear bullish rising channel. It is now dealing with technical resistance from the convergence of the top of the rising channel and the May 1 closing high near 141. Next resistance, if it can continue to climb, is just above at the 52-week high from early April around 142. The 50-day simple moving average has turned up, and price sits comfortably above the 20-, 50-, 100-, and 200-day SMAs. If it can’t break out here through the top of the rising channel, it might cycle back down towards the bottom of the channel for a sixth time.
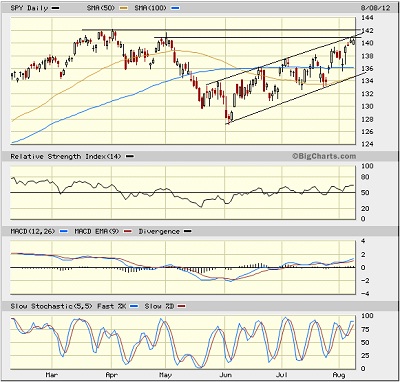
The SPY chart looks just about as bullish as it can be given the global economic environment. It just needs more volume.
The VIX (CBOE Market Volatility Index—a.k.a. “fear gauge”) has fallen precipitously since last week, closing Wednesday at 15.32. It is well below the important 20 level and seems ready to make a push through 15 to challenge the April lows. No investor fear is displayed here.
Despite recent market strength, Sabrient subsidiary Gradient Analytics, which produces in-depth forensic accounting research, has seen several of its negatively-rated stocks fall recently, including Ritchie Bros (RBA), comScore (SCOR), FARO Technologies (FARO), ViaSat (VSAT), Innophos Holdings (IPHS), and Abercrombie & Fitch (ANF). Others that fell during the past month include: Chipotle Mexican Grill (CMG), Power Integrations (POWI), International Rectifier (IRF), Mead Johnson Nutrition (MJN), Alere (ALR), Woodward (WWD), Varian Medical Systems (VAR), Cepheid (CPHD), Gentex (GNTX), Wipro (WIT), and Netflix (NFLX).
Among the firm’s relatively few positively-rated stocks, Six Flags Entertainment (SIX), TempurPedic (TPX), KeyCorp (KEY), Dish Network (DISH), Emerson Electric (EMR), and City National (CYN) have performed well.
Apparently it really does pay to scrutinize the quality of a company’s reported earnings and what the insiders are doing with their options incentives.
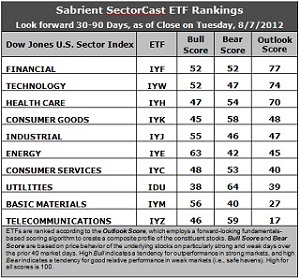
Latest rankings: The table ranks each of the ten U.S. industrial sector iShares (ETFs) by Sabrient’s proprietary Outlook Score, which employs a forward-looking, fundamentals-based, quantitative algorithm to create a bottom-up composite profile of the constituent stocks within the ETF. In addition, the table also shows Sabrient’s proprietary Bull Score and Bear Score for each ETF.
High Bull score indicates that stocks within the ETF have tended recently toward relative outperformance during particularly strong market periods, while a high Bear score indicates that stocks within the ETF have tended to hold up relatively well during particularly weak market periods. Bull and Bear are backward-looking indicators of recent sentiment trend.
As a group, these three scores can be quite helpful for positioning a portfolio for a given set of anticipated market conditions.
Observations:
1. Financial (IYF) retains the top spot with an Outlook score of 77, primarily due to ongoing support among analysts, who have not been revising earnings downward to stocks within IYF like they have been to the other economically-sensitive sectors. Technology (IYW) holds the second spot with a 74. Stocks within IYW are displaying relatively low forward P/Es, strong projected long-term growth, and solid return ratios.
2. Healthcare (IYH) remains a solid third with an Outlook score of 70, but then we are seeing a 22-point gap down to Consumer Goods (IYK) at 48. Only IYF, IYW, and IYH are scoring above the 50 mid-point level, whereas last week six of the ten sectors were scoring 50 or higher. I think this reflects a cautious tone among analysts, particularly given recent market strength and the slow-growth economy.
3. Telecom (IYZ) stays at the bottom of the Outlook rankings this week with an Outlook score of 17. It retains surprisingly good support from Wall Street and reasonably good growth projections, but stocks within IYZ are held back by the highest forward P/E and the worst return ratios. Basic Materials (IYM) continues to be hampered by cuts in Wall Street’s earnings estimates.
4. Looking at the Bull scores, Energy (IYE) is the clear leader on strong market days, scoring 63. Utilities (IDU) is still by far the weakest on strong days, scoring 38. In other words, Energy stocks have tended to perform the best when the market is rallying, while Utilities stocks have lagged.
5. Looking at the Bear scores, Utilities (IDU) remains the strong investor favorite “safe haven” on weak market days, scoring 64. Materials (IYM) has been abandoned (relatively speaking) by investors during market weakness, as reflected by its low Bear score of 40, followed by Energy (IYE) at 42. In other words, Materials stocks have tended to sell off the most when the market is pulling back, while Utilities stocks have held up the best.
6. Overall, Financial (IYF) shows the best all-weather combination of Outlook/Bull/Bear scores. Adding up the three scores gives a total of 181. Telecom (IYZ) is the worst at 122. As for Bull/Bear combination, Materials (IYM) is the worst at 96, while Telecom (IYZ) and Energy (IYE) tie for the best with 105.
These scores represent the view that the Financial and Technology sectors may be relatively undervalued overall, while Telecom and Materials sectors may be relatively overvalued, based on our 1-3 month forward look.
Top-ranked stocks within Financial and Technology sectors include First Merchants Corp (FRME), Texas Capital Bancshares (TCBI), Ellie Mae Inc. (ELLI), and Blucora Inc. (BCOR).
Disclosure: Author has no positions in stocks or ETFs mentioned.
About SectorCast: Rankings are based on Sabrient’s SectorCast model, which builds a composite profile of each equity ETF based on bottom-up scoring of the constituent stocks. The Outlook Score employs a fundamentals-based multi-factor approach considering forward valuation, earnings growth prospects, Wall Street analysts’ consensus revisions, accounting practices, and various return ratios. It has tested to be highly predictive for identifying the best (most undervalued) and worst (most overvalued) sectors, with a one-month forward look.
Bull Score and Bear Score are based on the price behavior of the underlying stocks on particularly strong and weak days during the prior 40 market days. They reflect investor sentiment toward the stocks (on a relative basis) as either aggressive plays or safe havens. So, a high Bull score indicates that stocks within the ETF have tended recently toward relative outperformance during particularly strong market periods, while a high Bear score indicates that stocks within the ETF have tended to hold up relatively well during particularly weak market periods.
Thus, ETFs with high Bull scores generally perform better when the market is hot, ETFs with high Bear scores generally perform better when the market is weak, and ETFs with high Outlook scores generally perform well over time in various market conditions.
Of course, each ETF has a unique set of constituent stocks, so the sectors represented will score differently depending upon which set of ETFs is used. For Sector Detector, I use ten iShares ETFs representing the major U.S. business sectors.
About Trading Strategies: There are various ways to trade these rankings. First, you might run a sector rotation strategy in which you buy long the top 2-4 ETFs from SectorCast-ETF, rebalancing either on a fixed schedule (e.g., monthly or quarterly) or when the rankings change significantly. Another alternative is to enhance a position in the SPDR Trust exchange-traded fund (SPY) depending upon your market bias. If you are bullish on the broad market, you can go long the SPY and enhance it with additional long positions in the top-ranked sector ETFs. Conversely, if you are bearish and short (or buy puts on) the SPY, you could also consider shorting the two lowest-ranked sector ETFs to enhance your short bias.
However, if you prefer not to bet on market direction, you could try a market-neutral, long/short trade—that is, go long (or buy call options on) the top-ranked ETFs and short (or buy put options on) the lowest-ranked ETFs. And here’s a more aggressive strategy to consider: You might trade some of the highest and lowest ranked stocks from within those top and bottom-ranked ETFs, such as the ones I identify above.