

Reminder: Sabrient is available to chat with Members, comments are found below each post.
Courtesy of Ron Rutherford, Sabrient Systems and Gradient Analytics
The ISM reports showed mixed signals this time as the PMI (manufacturing) missed the consensus mark by 0.3% at 49.8%, and the NMI (non-manufacturing) beat the consensus by 0.6% at 52.6%. Although muted as usual, the Dow's initial reactions were in the same direction as the consensus miss and later, the consensus beat. Both indexes were inside the consensus range provided by Econoday (Mfg and Non-Mfg).
The manufacturing sub-indexes showed positive signs in production, up 0.3% to 51.3%; new orders were up 0.2% but stayed below 50% at 48%; and prices were up 2.5% to a more acceptable 39.5%. Prices down might be good overall but sustained price level drops can lead to the dreaded deflation. The biggest negative in the manufacturing report was the drop in employment of 4.6% to 52%. It maintained above 50 but the trend is clearly downward from 57.3% in April 2012. If it continues to decline, a drop below 50% signifies contraction in employment.
The non-manufacturing employment index also dropped significantly by 3% to 49.3%, breaking the 50% mark, meaning the hiring rate is contracting. But for the non-manufacturing sectors, there were extenuating facts that might indicate a potential snap back in this index in the near future. For example, new orders rose 1% to 54.3%; business activity jumped substantially by 5.5% to 57.2%; and new export orders was up 1.5% to 51%. Below is a graph of the non-manufacturing employment index since December 2009. Hopefully this time we bounce back above 50% just as we have done for the past couple of years.
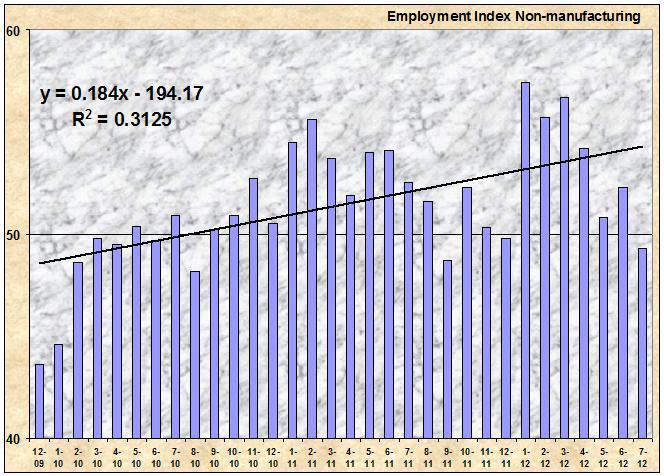
(Click to enlarge)
Investors often have the mind set of Goldilocks. That is, they want good numbers, but not too good, or too low. The price index is one such index that is justified in the Goldilocks approach. Prices rising too fast or dropping too quickly spell trouble for the future of the economy. As noted above, the manufacturing price index increased last month but still was anemic at 39.5%. Non-manufacturing increased 6% to an acceptable mid-fifty value of 54.9% after two months of contraction below the 50% mark.
Besides the price indexes, the Macro View also is also concerned with commodities rising in price and those declining in price. Not only can it be a portent of potential problems in the price indexes, it can indicate structural rigidity in not being able to either import needed materials or increase domestic production. This month continued its abnormal arrangement with more commodities going down in price than going up, especially between multi-month commodities, with over twice as many going down versus going up in price.
This Month's Model
The regression model used for the quick pick list below was a repeat of the Fama-French 3 factor model along with the change in the PMI index and 5 additional lags on the changes. Using changes in the index reduces the problem of autocorrelation in time-series data by creating a stochastic variable, and the lags capture the full effects of short term trends in the data. The immediate reaction to the release of the ISM reports was muted, but the reports did tell a story of the underlying strength or weakness of the economy, and as such, it eventually influences the markets.
I recently received some questions from a reader that was working on a similar project involving the PMI index and a group of stocks in the US markets that would be highly correlated with movements of the PMI. One question had to do with concerns about autocorrelation. It is one thing to presume that the model as envisaged would not have that statistical problem, and it is another to even not test for such problems. This last run did specifically test for autocorrelation using the Durbin-Watson statistic for autocorrelation. Even though the back-test regressions use around 1500 stocks over 48 rebalances, the results only showed around 2.5% to 3.3% of runs failing its test for autocorrelation at the 5% level. That was below what would be expected with just random sampling. The selections below were also filtered by the Durbin-Watson statistic.
There are plenty of ways of looking at the performances of portfolios, and below is one such novel approach, looking at the two model portfolios explained here. The graph below shows monthly returns for the S&P compared to the same month's returns for the two model portfolios (Lovers & Haters). The red dots represent the Lover's returns and the red hued lines represent the linear regression for months when the S&P had a positive return and negative returns. The blue dots and blue hued lines represent the Haters portfolio respectively. Some of the things to note on the graph is that the Lovers portfolio has greater beta than the benchmark as the slope on both positive and negative markets are greater sloped. The graph shows bigger gains and subsequently bigger losses. But the Haters show some pure alpha as the line is above the break-even line of the S&P for negative months. On positive months, though it does worse than the S&P. Thus it confirmed that the Haters can be a good hedge against the market turning sour and the Lovers are best when the market is going up.
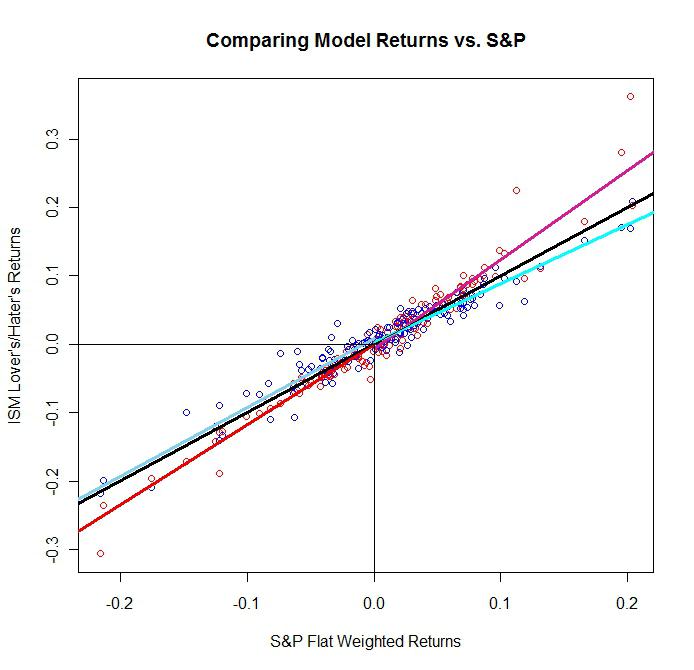
(Click to enlarge)
Stock Picks based on Changes in PMI with Lags
The back-test period for this stock selection was July 2000 to this month's release of the ISM reports for last month. Presumably because of tightening some the criteria, the Haters group of stocks performed better for the annualized return at over 1.5% above the S&P flat weighted portfolio (S&P). The lovers group received 0.50% over the S&P. The simple Sharpe ratio was 0.27 vs. 0.18 for the S&P. This occurred because the volatility was lower on the Haters sample than the Lovers and the S&P. A reader asked to confirm that I was using the geometric mean to calculate annualized return instead of the arithmetic mean as used in the Sharpe ratios. Yes, the annualized return is calculated by the product of all returns and then raising to the 1/(number of years).
Below are some of the stock picks from the regressions grouped by Haters and Lovers, and then rated by Sabrient. First, the Strong Buys were picked and then to diversify listings of market caps, Buys were added to the list.
HATERS (Bears):
AECOM Technology Corporation (ACM) STRONGBUY
Cerner Corporation (CERN) STRONGBUY
Cirrus Logic, Inc. (CRUS) STRONGBUY
Genworth Financial, Inc. (GNW) STRONGBUY
Oil States International, Inc. (OIS) STRONGBUY
priceline.com (PCLN) STRONGBUY
PNM Resources, Inc. (PNM) STRONGBUY
Tesoro Corporation (TSO) STRONGBUY
Valero Energy Corporation (VLO) STRONGBUY
Monarch Casino & Resort, Inc. (MCRI) BUY
ArQule, Inc. (ARQL) BUY
PDC Energy, Inc. (PDCE) BUY
TrueBlue, Inc. (TBI) BUY
United Fire Group, Inc., (UFCS) BUY
USA Mobility, Inc. (USMO) BUY
LOVERS (Bulls):
Air Methods Corporation (AIRM) STRONGBUY
Chesapeake Energy Corporation (CHK) STRONGBUY
Gannett Co., Inc. (GCI) STRONGBUY
United Therapeutics Corporation (UTHR) STRONGBUY
Western Digital Corporation (WDC)STRONGBUY
Basic Energy Services, Inc. (BAS) BUY
BBCN Bancorp, Inc. (BBCN) BUY
Headwaters Incorporated (HW) BUY
Multimedia Games Holding Company, Inc. (MGAM) BUY
Skechers U.S.A., Inc. (SKX) BUY
Ford Motor Company (F) BUY
Fifth Third Bancorp (FITB) BUY
Time Warner Cable Inc. (TWC) BUY
Textron Inc. (TXT) BUY
Helix Energy Solutions Group, Inc. (HLX) BUY
Disclosure: I have no positions in any stocks mentioned, and no plans to initiate any positions within the next 72 hours.
Disclaimer: This article is published solely for informational purposes and is not to be construed as advice or a recommendation to specific individuals. Individuals should take into account their personal financial circumstances in acting on any rankings or stock selections provided by Sabrient. Sabrient makes no representations that the techniques used in its rankings or selections will result in or guarantee profits in trading. Trading involves risk, including possible loss of principal and other losses, and past performance is no indication of future results.