

Reminder: Sabrient is available to chat with Members, comments are found below each post.
Courtesy of Sabrient Systems and Gradient Analytics
Volume has elevated somewhat this week, as Wednesday saw more trading volume than we have seen since the beginning of the month—likely due to the release of the FOMC minutes (both in anticipation and aftermath). In any case, equity holders have been loath to sell. Mild intraday weakness continues to be met with buying. You would think that any whiff of a disappointing economic report would send stocks plummeting, but instead markets have held their psychologically important support levels of Dow 13,000, Nasdaq 3,000, S&P 500 1400, and Russell 2000 800 without much trouble.
Some market observers are suggesting that the worse the news the better in that economic weakness will lead to another round of Fed stimulus (QE3), and that this emboldens the bulls in a contrarian way. But I don’t think severe economic weakness is really what investors want. What has encouraged bulls is an economy that is holding up okay, just not recovering as fast as we need, and perhaps lacking in confidence (both business and consumer). In such an environment, a little stimulus is likely on the horizon.
Wednesday’s release of the FOMC meeting minutes revealed serious discussion of a possible QE3, and the initial reaction to this at 11:00 ET was a market spike (about 8 points in the S&P 500). Rather than requiring that things get really bad before acting, additional stimulus likely would be employed “fairly soon unless incoming information pointed to a substantial and sustainable strengthening in the pace of the economic recovery.” We’ll see what Chairman Bernanke has to say at the annual monetary policy conference next week in Jackson Hole. Then, the next FOMC meeting takes place September 12-13.
In any case, global investors are putting up a more confident front. Pull up charts of European equities and 10-year bond yields in at-risk places like Spain and Italy. Yields are falling through the uptrend line that had been forming since March as bondholders appear to be feeling more confident about repayment, while stocks are forming bullish patterns for many of the same reasons.
It seems that U.S. stocks are hanging around awaiting a spark to light their fire. Perhaps it will be QE3, or perhaps a breakthrough with Europe’s debt situation. However, let’s be aware that September and October can be notoriously volatile…and the impending U.S. presidential election may add some fuel, as well.
One quick comment about the polarizing rhetoric on the presidential campaign trail. Unfortunately, the past tells us that no matter who wins the election, the other side likely will be as obstructive as possible in preventing any bold initiatives from passing, much less succeeding. Contrast this approach with private life. In a marriage, if one spouse constantly seeks to undermine the other, the marriage will collapse. Likewise, in a business, divergent opinions are welcomed and explored (often vigorously), but once a strategic direction is decided upon, everyone must get onboard to work together or it surely will lead to failure of the business in a competitive marketplace. Only in a representative democracy can one side get away with openly trying to undermine the other’s initiatives.
The reason, of course, is that cooperating with the party in power might help them to actually succeed (heaven forbid!), which lessens the likelihood of the cooperating party winning the next election. In a business, failure of one party means failure of all, and cooperation is imperative. Blatant attempts to undermine will get you fired. Only in government will you see one side freely admit that their number one objective is to ensure the failure of the other party’s initiatives—with no repercussions.
Now, back to the markets. From a technical standpoint, many market observers continue to insist that we are way overdue for at least a minor correction to this nearly month-long unabated uptrend. Looking at the SPY chart, it closed Wednesday at 141.82 after trading above 143 on Tuesday to hit new 52-week highs. It has been trading within a bullish rising channel for about 3 months. SPY is still dealing with technical resistance from the convergence of the top of the rising channel and the April-May highs, and in fact it has been forming a mini rising channel within the larger rising channel for the past couple of weeks. The 50-day simple moving average has crossed up bullishly through the 100-day SMA. Price still sits comfortably above the 20-, 50-, 100- and 200-day SMAs.
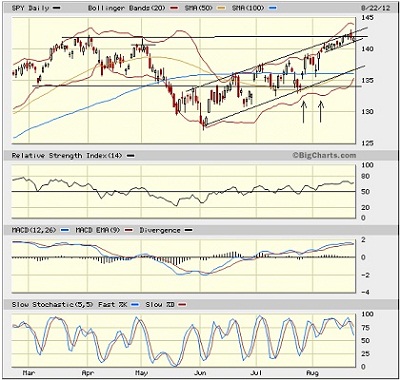
Some technicians are warning of a triple top sell signal, and others are saying the prior gaps (identified by the arrows) likely will be filled, which may take SPY back down to test 134. But there is a lot of support between here and there, including the rising 50-day SMA, the bottom of the larger rising channel, and the 100-day SMA. As I said last week, bulls just need more volume to break out of this pattern, although further consolidation of the oscillators (e.g., RSI, MACD, and Slow Stochastic) would be healthy.
The VIX (CBOE Market Volatility Index—a.k.a. “fear gauge”) has bounced slightly after hitting a 3-year low last week, closing Wednesday at 15.11. Still, there’s not much evidence of investor anxiety that might be expected given the tenuous global economic situation.
By the way, I periodically point out that Sabrient subsidiary Gradient Analytics, which produces in-depth forensic accounting research, has been particularly successful at rooting out firms with questionable earnings quality and revenue-recognition practices. Let me also point that Gradient is also pretty good at identifying positive trends. For example, Coventry Health Care (CVH), NVIDIA (NVDA), Six Flags Entertainment (SIX), Tempur-Pedic (TPX), KeyCorp (KEY), DISH Network (DISH), Emerson Electric (EMR), and City National (CYN) have performed particularly well after encouraging trends were identified—mostly options exercise-and-hold activities among top brass (in which they are preparing for long-term capital gains treatment on anticipated gains), but also favorable earnings quality trends.
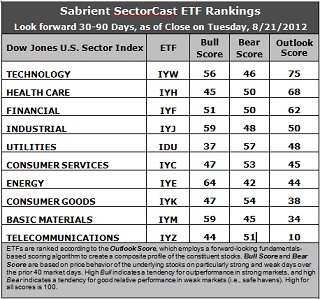
Latest rankings: The table ranks each of the ten U.S. industrial sector iShares (ETFs) by Sabrient’s proprietary Outlook Score, which employs a forward-looking, fundamentals-based, quantitative algorithm to create a bottom-up composite profile of the constituent stocks within the ETF. In addition, the table also shows Sabrient’s proprietary Bull Score and Bear Score for each ETF.
High Bull score indicates that stocks within the ETF have tended recently toward relative outperformance during particularly strong market periods, while a high Bear score indicates that stocks within the ETF have tended to hold up relatively well during particularly weak market periods. Bull and Bear are backward-looking indicators of recent sentiment trend.
As a group, these three scores can be quite helpful for positioning a portfolio for a given set of anticipated market conditions.
Observations:
1. Technology (IYW) remains in the top spot with an Outlook score of 75. Stocks within IYW are displaying relatively low forward P/Es, strong projected long-term growth, and solid return ratios. Healthcare (IYH) falls to 68 this week, but retains second place, while Financial (IYF) stays in third. Industrial (IYJ) moves back up into fourth place.
2. Overall, Wall Street analysts seem to have let up on their incessant lowering of earnings estimates. In particular, they have come back to the defense of Consumer Services (IYC) companies, as many of the earnings reports in the sector have been pretty good. Also, Utilities (IDU) continues to be well-supported by Wall Street, although the flipside is that long-term growth projections are still low, as you might expect for this sector. I think the rankings can be categorized as cautiously bullish this week, as IYJ, IYC, and Basic Materials (IYM) have all seen their scores improve.
3. Telecom (IYZ) stays at the bottom of the Outlook rankings this week with a dismal Outlook score of 10. Stocks within the sector suddenly got a slew of downgrades from Wall Street. They also are held back by the highest forward P/E and the worst return ratios. Basic Materials (IYM) is in the bottom two with a score of 34. It continues to be hampered by cuts in Wall Street’s earnings estimates (although it has improved markedly), but still reflects the lowest (best) forward P/E.
4. Looking at the Bull scores, Energy (IYE) is the clear leader on strong market days, scoring 64. Utilities (IDU) is still by far the weakest on strong days, scoring 37. In other words, Energy stocks have tended to perform the best when the market is rallying, while Utilities stocks have lagged.
5. Looking at the Bear scores, Utilities (IDU) remains the investor favorite “safe haven” on weak market days, scoring 57, but this is substantially lower than it has been. For a long time IDU has scored in the 60s and sometimes as high as 70. Energy (IYE), which has by far the highest Bull score, has been abandoned (relatively speaking) by investors during market weakness, as reflected by its low Bear score of 42. In other words, Energy stocks have tended to sell off the most when the market is pulling back, while Utilities stocks have held up the best.
6. Overall, Technology (IYW) again shows the best all-weather combination of Outlook/Bull/Bear scores. Adding up the three scores gives a total of 177. Telecom (IYZ) is the worst at 105. As for Bull/Bear combination, Utilities (IDU) is now the worst at 94, trailed closely by IYZ and IYH at 95, while Industrial (IYJ) is the best with 107.
These scores represent the view that the Technology and Healthcare sectors may be relatively undervalued overall, while Telecom and Materials sectors may be relatively overvalued based on our 1-3 month forward look.
Top-ranked stocks within Technology and Healthcare sectors include Akamai Technologies (AKAM), AOL Inc (AOL), Cynosure (CYNO), and Amgen (AMGN).
Disclosure: Author has no positions in stocks or ETFs mentioned.
About SectorCast: Rankings are based on Sabrient’s SectorCast model, which builds a composite profile of each equity ETF based on bottom-up scoring of the constituent stocks. The Outlook Score employs a fundamentals-based multi-factor approach considering forward valuation, earnings growth prospects, Wall Street analysts’ consensus revisions, accounting practices, and various return ratios. It has tested to be highly predictive for identifying the best (most undervalued) and worst (most overvalued) sectors, with a one-month forward look.
Bull Score and Bear Score are based on the price behavior of the underlying stocks on particularly strong and weak days during the prior 40 market days. They reflect investor sentiment toward the stocks (on a relative basis) as either aggressive plays or safe havens. So, a high Bull score indicates that stocks within the ETF have tended recently toward relative outperformance during particularly strong market periods, while a high Bear score indicates that stocks within the ETF have tended to hold up relatively well during particularly weak market periods.
Thus, ETFs with high Bull scores generally perform better when the market is hot, ETFs with high Bear scores generally perform better when the market is weak, and ETFs with high Outlook scores generally perform well over time in various market conditions.
Of course, each ETF has a unique set of constituent stocks, so the sectors represented will score differently depending upon which set of ETFs is used. For Sector Detector, I use ten iShares ETFs representing the major U.S. business sectors.
About Trading Strategies: There are various ways to trade these rankings. First, you might run a sector rotation strategy in which you buy long the top 2-4 ETFs from SectorCast-ETF, rebalancing either on a fixed schedule (e.g., monthly or quarterly) or when the rankings change significantly. Another alternative is to enhance a position in the SPDR Trust exchange-traded fund (SPY) depending upon your market bias. If you are bullish on the broad market, you can go long the SPY and enhance it with additional long positions in the top-ranked sector ETFs. Conversely, if you are bearish and short (or buy puts on) the SPY, you could also consider shorting the two lowest-ranked sector ETFs to enhance your short bias.
However, if you prefer not to bet on market direction, you could try a market-neutral, long/short trade—that is, go long (or buy call options on) the top-ranked ETFs and short (or buy put options on) the lowest-ranked ETFs. And here’s a more aggressive strategy to consider: You might trade some of the highest and lowest ranked stocks from within those top and bottom-ranked ETFs, such as the ones I identify above.