

Reminder: Sabrient is available to chat with Members, comments are found below each post.
Courtesy of Sabrient Systems and Gradient Analytics
The news has been dominated by the predictable on-and-off speculation about progress with Europe’s intractable debt crisis and the Fiscal Cliff here at home. With all the economic uncertainty, Wall Street analysts are struggling with their forward estimates for companies. Stocks have fluctuated accordingly, testing support and seeking catalysts. Nevertheless, the charts have suddenly brightened considerably, as Santa’s good cheer might be starting to emerge among the investment crowd, no matter what damper the outsiders try to throw on the proceedings.
I’m in the midst of road warrior duty. Last week I returned home from Tokyo, Hong Kong, and Singapore. This week I’m in Toronto. Next week I’m in New York City. The NYC trip will be highlighted by the big Bloomberg App Store event in which my colleagues and I will be demonstrating Sabrient’s new Equity Valuation and Ranking (EVR) application, an advanced stock and ETF screening, evaluation, and risk assessment tool. If you are in NYC, please come to the Bloomberg office to visit us. If you have access to a Bloomberg terminal, please take a free trial of EVR (APPS SABRIENT <GO>) and let us know what you think.
Let’s take a gander at the charts. The psychologically important levels at Dow 13,000, S&P 500 1,400, Russell 2000 800, and Nasdaq 3,000 all broke down strongly earlier this month, but a strong recovery has ensued. The S&P 500 has recaptured 1,400, the R2000 is back above 800, and the others are close.
The S&P 500 SPDR Trust (SPY) closed Wednesday at 141.46. The bull flag formation seems to have held support at its bottom line, and now the tentative breakout of the top line is trying to hold while consolidating…and attempts to ensure this is more than a simple oversold bounce. Price at 140 has served as strong support the past few days, which is positive, and it is now pressing to recapture the 100-day simple moving average. Overhead resistance looms at the convergence of prior support and the 50-day SMA near 143. RSI and MACD are looking bullish, although Slow Stochastic is a bit overbought and might need a little more consolidation before making a push higher.
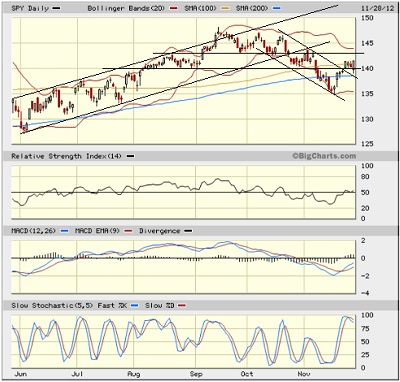
The CBOE Market Volatility Index (VIX), a.k.a. “fear gauge,” closed Wednesday at 15.51, which is still below the important 20 level and low in its historical range. Still no apparent fear.
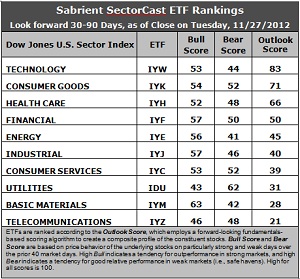
Latest rankings: The table ranks each of the ten U.S. industrial sector iShares (ETFs) by Sabrient’s proprietary Outlook Score, which employs a forward-looking, fundamentals-based, quantitative algorithm to create a bottom-up composite profile of the constituent stocks within the ETF. In addition, the table also shows Sabrient’s proprietary Bull Score and Bear Score for each ETF.
High Bull score indicates that stocks within the ETF have tended recently toward relative outperformance during particularly strong market periods, while a high Bear score indicates that stocks within the ETF have tended to hold up relatively well during particularly weak market periods. Bull and Bear are backward-looking indicators of recent sentiment trend.
As a group, these three scores can be quite helpful for positioning a portfolio for a given set of anticipated market conditions.
Observations:
1. Technology (IYW) returns to the top spot this week with an Outlook score of 83. The analysts have been somewhat quiet lately in their adjustments to earnings estimates, perhaps due to the Thanksgiving holiday, so the analyst scores in the Outlook rank are mostly irrelevant this week. This has allowed Consumer Goods (IYK) to garner the best analyst score and rise to number two in the Outlook rank. Stocks within IYW still show some of the best long-term growth rates, forward P/E, and return ratios. Besides its continued support among analysts, IYK also reflects strong return ratios.
2. Telecom (IYZ) stays in the cellar with an Outlook score of 21, and is once again joined in the bottom two by Basic Materials (IYM), scoring 28. Stocks within IYZ appear overvalued from the standpoint of the forward P/E, and stocks within IYM lack analyst support, including a weak projected long-term earnings growth rate.
3. Overall, I would continue to characterize the Outlook rankings as neutral, with the aggressive and defensive sectors mixed about in the rankings. Only three sectors score above 50, and two of those are defensive sectors (IYK and IYH). All of this indicates uncertainty about economic growth.
4. Looking at the Bull scores, Materials (IYM) is the clear leader on strong market days, scoring 63. Utilities (IDU) is the weakest on strong market days, scoring 43. In other words, Materials stocks have tended to perform the best when the market is rallying, while Utilities stocks have lagged.
5. Looking at the Bear scores, Utilities (IDU) is the clear investor safe haven on weak market days, scoring 62, which remains far ahead of second-place Healthcare (IYH) at 51. Energy (IYE) is the weakest during market weakness, as reflected in its low Bear score of 41, followed closely by Materials (IYM) at 42 and Technology (IYW) at 44. In other words, Energy stocks have been selling off the most lately when the market is pulling back, while Utilities stocks have held up the best.
6. Overall, Technology (IYW) now shows the best all-weather combination of Outlook/Bull/Bear scores. Adding up the three scores gives a total of 180. Telecom (IYZ) is by far the worst at 115. As for Bull/Bear combination, Financial (IYF) is the best at 107, while Telecom (IYZ) is the worst at 94.
These scores represent the view that the Technology and Consumer Goods sectors may be relatively undervalued overall, while Telecom and Basic Materials sectors may be relatively overvalued based on our 1-3 month forward look.
Top-ranked stocks within IYW and IYK include Google (GOOG), Rackspace Hosting (RAX), Ingredion (INGR), and PVH Corp (PVH).
Disclosure: Author has no positions in stocks or ETFs mentioned.
About SectorCast: Rankings are based on Sabrient’s SectorCast model, which builds a composite profile of each equity ETF based on bottom-up aggregate scoring of the constituent stocks. The Outlook Score employs a fundamentals-based multi-factor approach considering forward valuation, earnings growth prospects, Wall Street analysts’ consensus revisions, accounting practices, and various return ratios. It has tested to be highly predictive for identifying the best (most undervalued) and worst (most overvalued) sectors, with a 1-3 month forward look.
Bull Score and Bear Score are based on the price behavior of the underlying stocks on particularly strong and weak days during the prior 40 market days. They reflect investor sentiment toward the stocks (on a relative basis) as either aggressive plays or safe havens. So, a high Bull score indicates that stocks within the ETF have tended recently toward relative outperformance during particularly strong market periods, while a high Bear score indicates that stocks within the ETF have tended to hold up relatively well during particularly weak market periods.
Thus, ETFs with high Bull scores generally perform better when the market is hot, ETFs with high Bear scores generally perform better when the market is weak, and ETFs with high Outlook scores generally perform well over time in various market conditions.
Of course, each ETF has a unique set of constituent stocks, so the sectors represented will score differently depending upon which set of ETFs is used. For Sector Detector, I use ten iShares ETFs representing the major U.S. business sectors.
About Trading Strategies: There are various ways to trade these rankings. First, you might run a sector rotation strategy in which you buy long the top 2-4 ETFs from SectorCast-ETF, rebalancing either on a fixed schedule (e.g., monthly or quarterly) or when the rankings change significantly. Another alternative is to enhance a position in the SPDR Trust exchange-traded fund (SPY) depending upon your market bias. If you are bullish on the broad market, you can go long the SPY and enhance it with additional long positions in the top-ranked sector ETFs. Conversely, if you are bearish and short (or buy puts on) the SPY, you could also consider shorting the two lowest-ranked sector ETFs to enhance your short bias.
However, if you prefer not to bet on market direction, you could try a market-neutral, long/short trade—that is, go long (or buy call options on) the top-ranked ETFs and short (or buy put options on) the lowest-ranked ETFs. And here’s a more aggressive strategy to consider: You might trade some of the highest and lowest ranked stocks from within those top and bottom-ranked ETFs.