

Reminder: Sabrient is available to chat with Members, comments are found below each post.
Courtesy of Sabrient Systems and Gradient Analytics
Stocks have been on a one-way train all month long. Now, as we approach Groundhog Day, the market appears to be having its own version of it as the Dow faces 14,000 and the S&P 500 struggles at 1500. As investors peer out above these levels, will they collectively see their shadow and retreat to safety for the next six weeks? Or will they bravely march forward into the clear blue skies to challenge the all-time highs from 2007?
The market may have foreshadowed its near-term intentions on Tuesday when, despite rising overall on the day, it was led by defensive sectors like Healthcare, Consumer Goods, and Utilities.
Seemingly overlooked during this period of falling bonds and rising stocks is the strength in crude oil. Light sweet crude is nearing the $100 mark for the first time since last May. Unless there is some direct threat to global supplies, this is usually a sign of rising demand and the expectation of a stronger global economy. In fact, supply forecasts are improving with increased domestic production, which should be keeping a lid on price increases. Nevertheless, oil stocks have been strong—particularly the refining & marketing firms, as demonstrated by Tuesday’s earnings report from Valero (VLO). Sabrient favorites Marathon Petroleum (MPC), HollyFrontier (HFC), and Tesoro (TSO) are also on a roll.
Although Wednesday morning brought news that the fourth quarter GDP actually contracted by 0.1% (rather than rise by 1.0% as most expected), a huge 22% decline in government Defense Spending was a primary culprit, while the important Personal Consumption component rose a healthy 2.2%. Also, the FOMC policy statement suggested little change in economic conditions and no change in the Fed’s policies.
The S&P 500 SPDR Trust (SPY) closed Wednesday at 150.07 as it struggles to break away from this 150 level. Last-minute buying kept it above 150, but just barely. The wide Bollinger Bands are starting to pinch back together. The 50-day simple moving average has crossed up bullishly through the 100-day SMA. However, oscillators RSI, MACD, and Slow Stochastic are still extremely overbought as bulls have refused to give up much ground…yet.
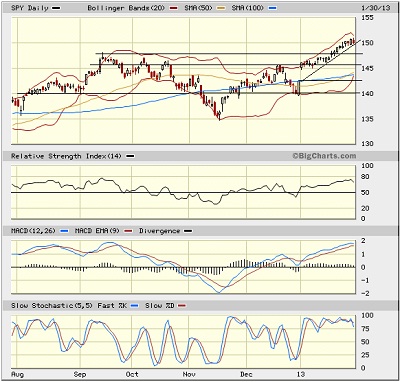
I have drawn a new uptrend line of support starting from the bottom of the New Year’s gap, which could get at least partially filled if the market decides it needs to make a serious test of support, but I doubt it will fall that far. After the uptrend line, next support levels is prior resistance-turned-support at 148, followed by the bottom of the prior zone of resistance at 146, then the New Year’s gap from 142, and finally the 200-day SMA around 140.
Notably, over the same 6-month period, the Russell 2000 Small Cap Index and S&P 400 Mid Cap Index have about doubled the strong performance of the S&P 500, and indeed they both pulled back much more significantly on Wednesday, which might be foreshadowing a larger pullback in the overall market.
The CBOE Market Volatility Index (VIX), a.k.a. “fear gauge,” closed Wednesday at 14.32, and it has been rising as expected from the extreme lows it has seen lately. It is possible for the VIX to work off its extremely overbought technical condition without stocks giving up too much ground. We shall see.
By the way, in case you’re wondering, I’m still holding the last of my SPY Feb 144 call options to see if the S&P 500 can break through the 150 level with some gusto before expiration.
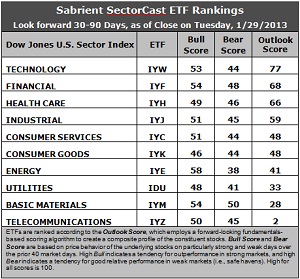
Latest rankings: The table ranks each of the ten U.S. industrial sector iShares (ETFs) by Sabrient's proprietary Outlook Score, which employs a forward-looking, fundamentals-based, quantitative algorithm to create a bottom-up composite profile of the constituent stocks within the ETF. The multi-factor model considers forward valuation, historical earnings trends, earnings growth prospects, the dynamics of Wall Street analysts' consensus estimates, accounting practices and earnings quality, and various return ratios. In addition, the table also shows Sabrient's proprietary Bull Score and Bear Score for each ETF.
High Bull score indicates that stocks within the ETF have tended recently toward relative outperformance during particularly strong market periods, while a high Bear score indicates that stocks within the ETF have tended to hold up relatively well during particularly weak market periods. Bull and Bear are backward-looking indicators of recent sentiment trend.
As a group, these three scores can be quite helpful for positioning a portfolio for a given set of anticipated market conditions.
Observations:
1. Technology (IYW) returns to the top spot with a score of 77, while Healthcare (IYH) falls to third place behind a resurgent Financial (IYF), which displays an Outlook score of 68. Although it has lost some Wall Street analyst support, IYW shows strong projected growth and the best forward valuation, as well as solid return ratios. After its big 25-point jump last week, IYF has maintained its support from Wall Street.
2. Telecom (IYZ) stays in the cellar with a worsening Outlook score of 2, as Wall Street has continued to slash estimates. It is now joined in the bottom two this week by Basic Materials (IYM) with a 28. In fact, IYM fell by 30 points this week, primarily due to analysts slashing estimates.
3. Overall, this week’s rankings are now notably more bullish, particularly given the rise in economically-sensitive sectors Industrial (IYJ) and Consumer Services (IYC) and the fall in defensive sectors Consumer Goods (IYK) and Healthcare (IYH). In fact, IYC rose by 30 points this week.
4. Looking at the Bull scores, Energy (IYE) is the leader on strong market days, scoring 58, while Consumer Goods (IYK) is the laggard on strong market days, scoring 46. This is only a 12-point range from top to bottom, which indicates high correlation on particularly strong market days. In other words, Energy stocks have tended to perform the best when the market is rallying, while Consumer Goods stocks have lagged.
5. Looking at the Bear scores, Basic Materials (IYM), which used to be among the worst on weak days, is scoring the highest at 50. Energy (IYE) is the worst during market weakness, as reflected in its low Bear score of 38. But there’s still only a 12-point range from top to bottom, which indicates high correlation on particularly weak market days. Thus, Energy stocks have been selling off the most when the market is pulling back, while Materials stocks have held up the best, relatively speaking.
6. Overall, Technology (IYW) shows the best all-weather combination of Outlook/Bull/Bear scores. Adding up the three scores gives a total of 174. Telecom (IYZ) is by far the worst at 97. Looking at just the Bull/Bear combination, Consumer Goods (IYK) is the lowest at 90, while Basic Materials (IYM) has the best score at 104, which indicates that Materials stocks have tended to perform relatively well lately in all market conditions.
These scores represent the view that the Technology and Financial sectors may be relatively undervalued overall, while Telecom and Basic Materials sectors may be relatively overvalued based on our 1-3 month forward look.
Top-ranked stocks within IYW and IYF include CommVault Systems (CVLT), Tech Data (TECD), PartnerRe (PRE), and BlackRock (BLK).
By the way, Sabrient subsidiary Gradient Analytics, a forensic accounting research firm that publishes in-depth reports on selected stocks from the standpoint of earnings quality and anomalous executive behavior (e.g., equity incentives and insider selling), had a couple of its negatively rated stocks fall this week after poor earnings reports, including Jos A Bank (JOSB) and Haemonetics (HAE). Notably, JOSB tried to go under the radar by releasing their bad news at 8:05 p.m. EST on Friday night.
Disclosure: Author has no positions in stocks or ETFs mentioned.
About SectorCast: Rankings are based on Sabrient’s SectorCast model, which builds a composite profile of each equity ETF based on bottom-up aggregate scoring of the constituent stocks. The Outlook Score employs a fundamentals-based multi-factor approach considering forward valuation, earnings growth prospects, Wall Street analysts’ consensus revisions, accounting practices, and various return ratios. It has tested to be highly predictive for identifying the best (most undervalued) and worst (most overvalued) sectors, with a 1-3 month forward look.
Bull Score and Bear Score are based on the price behavior of the underlying stocks on particularly strong and weak days during the prior 40 market days. They reflect investor sentiment toward the stocks (on a relative basis) as either aggressive plays or safe havens. So, a high Bull score indicates that stocks within the ETF have tended recently toward relative outperformance during particularly strong market periods, while a high Bear score indicates that stocks within the ETF have tended to hold up relatively well during particularly weak market periods.
Thus, ETFs with high Bull scores generally perform better when the market is hot, ETFs with high Bear scores generally perform better when the market is weak, and ETFs with high Outlook scores generally perform well over time in various market conditions.
Of course, each ETF has a unique set of constituent stocks, so the sectors represented will score differently depending upon which set of ETFs is used. For Sector Detector, I use ten iShares ETFs representing the major U.S. business sectors.
About Trading Strategies: There are various ways to trade these rankings. First, you might run a sector rotation strategy in which you buy long the top 2-4 ETFs from SectorCast-ETF, rebalancing either on a fixed schedule (e.g., monthly or quarterly) or when the rankings change significantly. Another alternative is to enhance a position in the SPDR Trust exchange-traded fund (SPY) depending upon your market bias. If you are bullish on the broad market, you can go long the SPY and enhance it with additional long positions in the top-ranked sector ETFs. Conversely, if you are bearish and short (or buy puts on) the SPY, you could also consider shorting the two lowest-ranked sector ETFs to enhance your short bias.
However, if you prefer not to bet on market direction, you could try a market-neutral, long/short trade—that is, go long (or buy call options on) the top-ranked ETFs and short (or buy put options on) the lowest-ranked ETFs. And here’s a more aggressive strategy to consider: You might trade some of the highest and lowest ranked stocks from within those top and bottom-ranked ETFs.