

Courtesy of Sabrient Systems and Gradient Analytics
 As the charts last week indicated might happen, the S&P 500 has fallen four straight days and failed to hold its breakout above 1800 while the Dow Jones Industrials lost 16,000. Only the NASDAQ is still holding on to its breakout above 4000. Although the Basic Materials sector was the leader on Wednesday, the Technology sector was strong, as well, and in fact Tech stocks have been the strongest over the past week and the past month.
As markets finally show a willingness to pullback somewhat from their torrid pace, the bears are trotting out every naysayer they can lay their hands on to scare investors away, including smart folks like Carl Icahn, who is “very cautious,” and Nobel Prize winner Robert Shiller and his stock market “bubble” assertions. Sure, valuations are high on a historical basis, but on the other hand, modern technology, a service-oriented economy, and economic globalization have led to sustainably higher return ratios and growth opportunities. The real question is not how we compare with valuations from the ‘50s and ‘60s, but whether earnings growth will materialize as expected given the lessening-but-still-onerous global economic uncertainties, as well as our lovably inept Congress as they enter the second attempt at addressing the budget and debt ceiling.
One unexpected boon to the economy has been the pullback in oil prices, due to a combination of increased domestic (U.S. and Canada) production and Iranian oil returning to the market. Another surprising factor is the persistently high short interest, which can be a supportive of the uptrend when those positions are unwound.
My best suggestion is to use this minor pullback/consolidation as a buying opportunity…but stay away from the more speculative high-P/E stocks.
By the way, Sabrient’s “Baker’s Dozen” annual portfolio of high-potential GARP stocks has surpassed the +43% return of last year’s portfolio and is now up +45.4% since inception on January 11, doubling the S&P 500 return of +21.8% over the same timeframe. Moreover, all 13 stocks are comfortably positive and 12 are up by double digit percentages, led by gains of +107% in Jazz Pharmaceuticals (JAZZ), 88% in Genworth Financial (GNW), 59% in Alaska Air Group (ALK), 55% in NXP Semiconductor (NXPI), and 50% in Seagate Technology (STX). In fact, the worst performer is Ashland (ASH), which is up “only” +9.5% since January 11. (Note: the next Baker’s Dozen annual portfolio for 2014 will launch on January 13.)
The 2013 portfolio has experienced no offsetting meltdowns, and we believe our proprietary Earnings Quality Rank (EQR) is a primary reason. EQR is a pure accounting-based risk assessment signal based on the forensic accounting expertise of subsidiary Gradient Analytics. Gradient also produces in-depth reports on individual companies (U.S. and international), including a negative alert last month on Swedish firm Elekta AB, which took a 5% fall on Wednesday after its earnings report, and a negative thesis on Synopsys (SNPS), which fell 4% afterhours following its earnings report.
The SPY chart: The SPDR S&P 500 Trust (SPY) closed Wednesday at 179.73, as the 20-day simple moving average once again provided solid support. As I pointed out last week, the chart had become extremely extended from its 20- and 50-day simple moving averages. Also, I saw what could be interpreted as a bearish rising wedge, with a support target down around 175 where the 50-day simple moving average converges with prior strong support. The oscillators like RSI, MACD and Slow Stochastic have each started to cycle back down from overbought territory; however, bulls have been very reluctant to give up much ground as so many commentators (including me) are predicting a year-end rally. It might not reach my downside support target of 175 before the “buy the dip” mentality takes control.
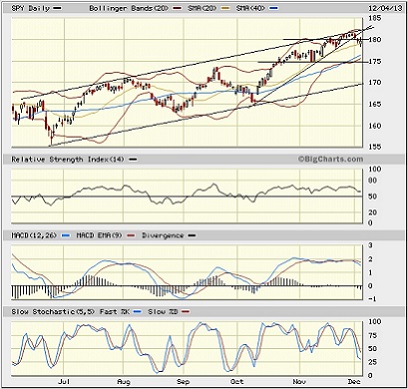
The CBOE Market Volatility Index (VIX), a.k.a. “fear gauge,” closed Wednesday at 14.70, which is up from last Wednesday, of course, as the market has been falling. However, it is still below the 15 threshold and well below the important 20 level. There is very little fear being reflected in this overdue market pullback…or retrenchment.
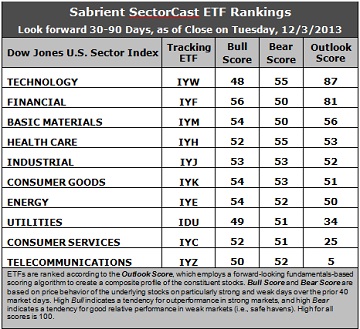
Latest rankings: The table ranks each of the ten U.S. business sector iShares ETFs by Sabrient’s proprietary Outlook Score, which employs a forward-looking, fundamentals-based, quantitative algorithm to create a bottom-up composite profile of the constituent stocks within the ETF. The multi-factor model considers forward valuation, historical earnings trends, earnings growth prospects, the dynamics of Wall Street analysts’ consensus estimates, accounting practices and earnings quality, and various return ratios. In addition, the table also shows Sabrient’s proprietary Bull Score and Bear Score for each ETF.
High Bull score indicates that stocks within the ETF have tended recently toward relative outperformance during particularly strong market periods, while a high Bear score indicates that stocks within the ETF have tended to hold up relatively well during particularly weak market periods. Bull and Bear are backward-looking indicators of recent sentiment trend.
As a group, these three scores can be quite helpful for positioning a portfolio for a given set of anticipated market conditions.
Observations:
1. Technology (IYW) retains the top spot this week with an Outlook score of 87. IYW still displays one of the lowest forward P/Es, a solid long-term forward growth rate, and the best return ratios, and the strongest sentiment among Wall Street analysts, in the way of upgrades to earnings estimates. Financial (IYF) takes second place with an 81. It displays one of the lowest forward P/Es and excellent sentiment among both Wall Street analysts and company insiders. IYW and IYF sit well above the rest of the field.
2. Telecom (IYZ) is in the cellar yet again with an Outlook score of 5. IYZ scores the absolute lowest on every factor in the model, including the highest forward P/E, lowest return ratios, a low projected long-term growth rate, and poor sentiment among insiders and Wall Street analysts. Consumer Services (IYC) remains in the bottom two with an Outlook score of 25. Although it enjoys the best projected long-term growth rate, IYC’s forward P/E is too high.
3. There was a bit of shuffling in the middle five sectors, but it is largely irrelevant because their scores are so close together, ranging from 56 for third place Basic Materials (IYM) to 50 for seventh place Energy (IYE). IYM continues to slowly rise as it gains support from Wall Street. The other three sectors in between are Healthcare (IYH), Industrial (IYJ), and Consumer Goods (IYK).
4. This week’s fundamentals-based rankings strengthened their bullish bias, with seven sectors — including economically-sensitive Tech, Financial, Materials, Industrial, and Energy — all scoring at 50 or better.
5. Looking at the Bull scores, Financial (IYF) has been the leader on particularly strong market days, scoring 56. It is notable that 8 of the 10 sectors are still scoring above 50. At the bottom is Technology (IYW) with a score of 48. The top-bottom spread is still only 8 points, which continues to indicate high sector correlations (all-boats-lifted buying) on particularly strong market days.
6. Looking at the Bear scores, Technology (IYW), which has been the leading sector during this recent market slide, not surprisingly saw a boost to its Bear score to 55, which ties it with Healthcare (IYH) for the highest. IYH has enjoyed almost the same strong performance as IYW over the past month. They are the favorite “safe havens” on weak market days. However, it is notable that all 10 sectors are scoring at or above 50. Financial (IYF) and Materials (IYM) share the lowest score of 50. The top-bottom spread is only 5 points, which indicates extremely high sector correlations (across-the-board selling) on particularly weak market days.
7. Overall, IYW shows the best all-weather combination of Outlook/Bull/Bear scores. Adding up the three scores gives a total of 190. IYZ is the by far the worst at 107. Looking at just the Bull/Bear combination, IYK and IYH display the highest scores of 107 this week, followed closely by IYF and IYE at 106. Their scores indicate good relative performance in extreme market conditions (whether bullish or bearish), while IDU is the lowest at 100, which indicates investor avoidance (relatively speaking) during extreme conditions.
These Outlook scores represent the view once again that Technology and Financial sectors are still relatively undervalued, while Telecom and Consumer Services may be relatively overvalued based on our 1-3 month forward look.
Some interesting stocks that are components of IYW and IYF include Cognizant Technology Solutions (CTSH), Western Digital (WDC), Visa (V), and Altisource Portfolio Solutions (ASPS). All are highly ranked in the Sabrient Ratings Algorithm, and all score in the top quintile of the Sabrient/Gradient Earnings Quality Rank.
Disclosure: Author has no positions in stocks or ETFs mentioned.
About SectorCast: Rankings are based on Sabrient’s SectorCast model, which builds a composite profile of each equity ETF based on bottom-up aggregate scoring of the constituent stocks. The Outlook Score employs a fundamentals-based multi-factor approach considering forward valuation, earnings growth prospects, Wall Street analysts’ consensus revisions, accounting practices, and various return ratios. It has tested to be highly predictive for identifying the best (most undervalued) and worst (most overvalued) sectors, with a 1-3 month forward look.
Bull Score and Bear Score are based on the price behavior of the underlying stocks on particularly strong and weak days during the prior 40 market days. They reflect investor sentiment toward the stocks (on a relative basis) as either aggressive plays or safe havens. So, a high Bull score indicates that stocks within the ETF have tended recently toward relative outperformance during particularly strong market periods, while a high Bear score indicates that stocks within the ETF have tended to hold up relatively well during particularly weak market periods.
Thus, ETFs with high Bull scores generally perform better when the market is hot, ETFs with high Bear scores generally perform better when the market is weak, and ETFs with high Outlook scores generally perform well over time in various market conditions.
Of course, each ETF has a unique set of constituent stocks, so the sectors represented will score differently depending upon which set of ETFs is used. For Sector Detector, I use ten iShares ETFs representing the major U.S. business sectors.
About Trading Strategies: There are various ways to trade these rankings. First, you might run a sector rotation strategy in which you buy long the top 2-4 ETFs from SectorCast-ETF, rebalancing either on a fixed schedule (e.g., monthly or quarterly) or when the rankings change significantly. Another alternative is to enhance a position in the SPDR Trust exchange-traded fund (SPY) depending upon your market bias. If you are bullish on the broad market, you can go long the SPY and enhance it with additional long positions in the top-ranked sector ETFs. Conversely, if you are bearish and short (or buy puts on) the SPY, you could also consider shorting the two lowest-ranked sector ETFs to enhance your short bias.
However, if you prefer not to bet on market direction, you could try a market-neutral, long/short trade—that is, go long (or buy call options on) the top-ranked ETFs and short (or buy put options on) the lowest-ranked ETFs. And here’s a more aggressive strategy to consider: You might trade some of the highest and lowest ranked stocks from within those top and bottom-ranked ETFs.